
Figure 1. A colistin-resistant subpopulation increases in frequency during in vivo infection.
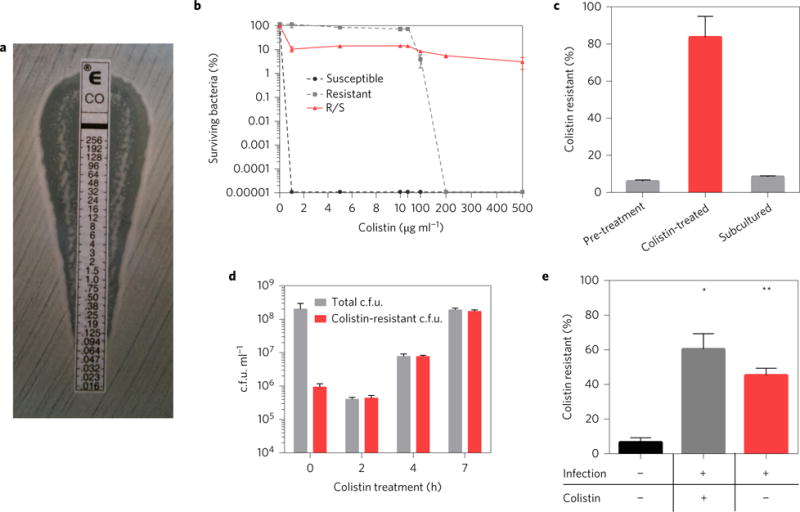
a, Testing of E. cloacae clinical isolate R/S by colistin Etest, with drug concentration indicated in μg ml−1. Colonies within the zone of inhibition indicate a colistin-resistant subpopulation. Data are representative of more than ten Etests. b, Population analysis profile of R/S as well as colistin-susceptible and -resistant E. cloacae clinical isolates (n = 3). c, Percentage of the colistin-resistant subpopulation in R/S in antibiotic-free media, after 24 h treatment with 100 μg ml−1 colistin and after 8 h subculture of the colistin-treated culture in antibiotic-free media. ‘Colistin resistant (%)’ represents the number of c.f.u. in each culture that can grow on media containing 100 μg ml−1 colistin, as a percentage of the total c.f.u. in the culture (n = 3). d, Colistin-resistant c.f.u. and total c.f.u. of R/S during 7 h treatment with 100 μg ml−1 colistin in liquid culture (n = 3). e, Pre-infection inoculum (black bar) was used to infect mice and peritoneal lavage was performed and collected 24 h later and plated to calculate per cent colistin-resistant c.f.u. (n = 5). Mice were treated at 8, 14 and 20 h with colistin (grey bar) or PBS (red bar). Error bars represent standard error of the mean (s.e.m.) (Mann–Whitney test, *P < 0.05, **P < 0.01).