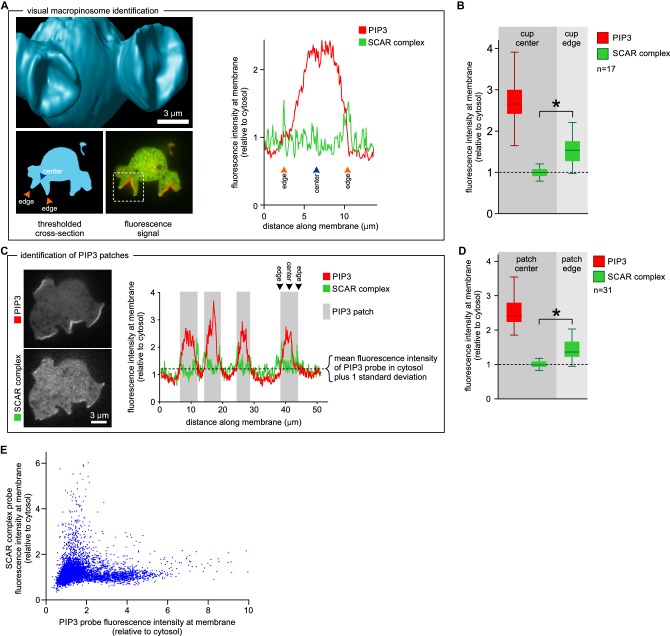
Figure 3. SCAR is present at the edge but not the centre of the macropinocytic cup.
(A, B) Quantification of PIP3 and SCAR in macropinocytic cups identified visually. (A) Method of analysis: Macropinocytic cups were identified morphologically from 3D rendered images and the position of their center (blue arrow) and edge (orange arrows) was noted. Fluorescence intensity along the cell membrane of the boxed macropinocytic cup was plotted and the intensity was measured at the marked center and edge. (B) PIP3 and SCAR fluorescence intensity at center and edge of 17 visually identified macropinocytic cups. Bar indicates the mean, box indicates the second and third quartile. Whiskers indicate the range of the data. (C, D) Analysis of SCAR in PIP3 patches. (C) Method of PIP3 patch analysis: Membrane-bound fluorescence intensity of the respective markers was measured for individual cells. PIP3 patches were defined as those membrane regions where the fluorescence intensity is greater than mean cytosol plus one standard deviation (dotted line) and these regions are marked in grey. (D) Quantification of fluorescence intensity at the centers and edges of 31 identified PIP3 patches. Bar indicates the mean, box indicates the second and third quartile. Whiskers indicate the range of the data. (E) Anti-correlation between SCAR and PIP3 reporter intensity. In this analysis the intensity of fluorescence in all membrane pixels was compared, irrespective of the morphological structure in which they lay. The plot shows the combined data from 16 cells. Vegetative Ax2 cells expressing the SCAR complex reporter HSPC300-GFP and the PI(3,4,5)P3 reporter PH-CRAC-mRFP were used in all experiments. The asterisk marks significant differences (p<0.01).

