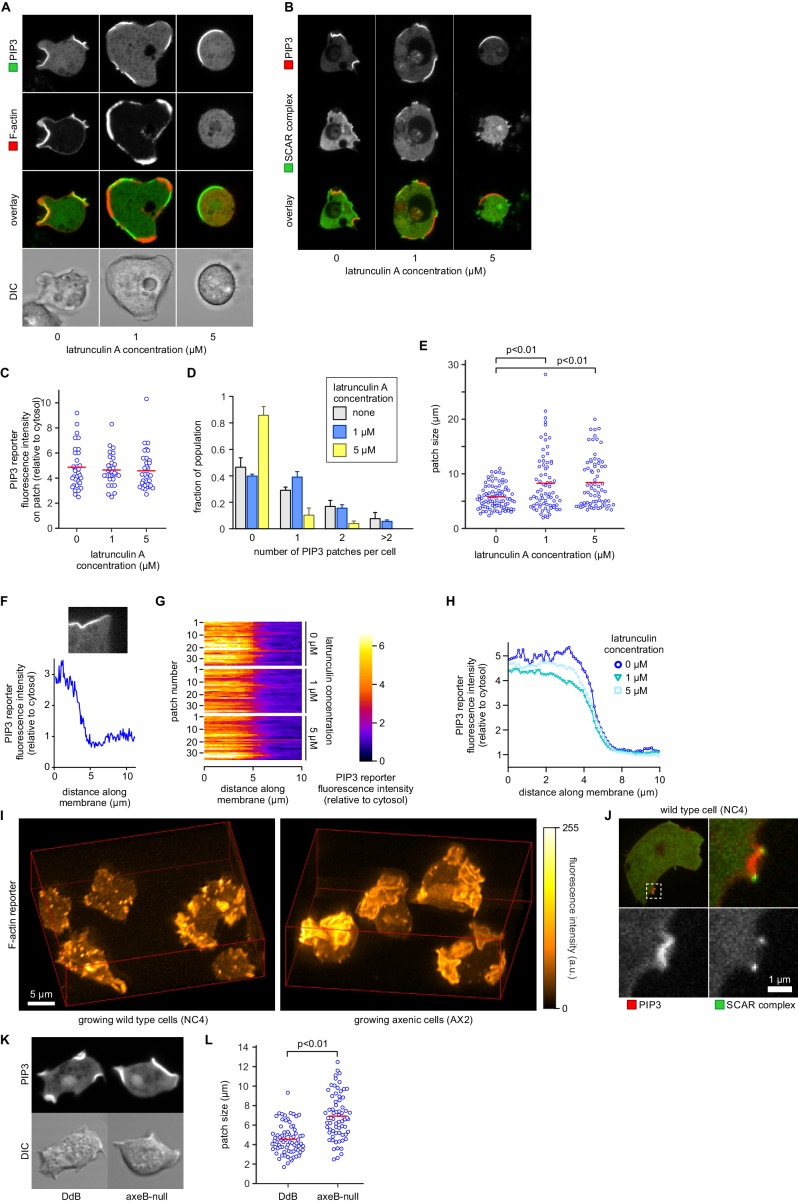
Figure 7. PIP3 patch formation does not require an encircling actin ruffle, but patch size is regulated by Ras activity.
(A) The actin cytoskeleton is depolymerized by treatment with latrunculin-A and ruffles suppressed. Vegetative cells expressing an F-actin marker (Lifeact) and a PIP3 marker (PH-CRAC) were treated for 15 min with the indicated amounts of latrunculin-A. The F-actin marker is undetectable in the cortex when treated with 5 μM latrunculin-A. (B) PIP3 patches remain after ruffles are suppressed by depolymerisation of the actin cytoskeleton. SCAR remains associated with the patch edge under 1 μM latrunculin-A, but is lost when treated with 5 μM latrunculin-A. (C–E) Ruffles are not essential for PIP3 patch formation. Treatment with latrunculin-A does not significantly change PIP3 patch intensity, but leads to an increase in size and a decrease in number. (F–H) Patch boundaries are sharply defined and this does not depend on an enclosing ruffle. (F) Membrane fluorescence intensity across the edge of PIP3 patches was measured (G) Measured intensity profiles along the edge of 36 patches of both treated and untreated cells, with each line representing a single patch. (H) Mean fluorescence intensity of the PIP3 reporter along the patch edges of treated and untreated cells, obtained by averaging the profiles in the previous panel. (I) Macropinocytic cups in vegetative cells of wild-type cells are smaller than those of axenic strains. Shown is a maximum intensity projection of the F-actin reporter LimEΔcoil of a field of vegetative cells, recorded using lattice light sheet microscopy. (J) SCAR is still recruited to the edges of the PIP3 patch of the small macropinocytic cups of wild-type cells. (K–L) Increased Ras activity leads to larger PIP3 patches and macropinocytic cups. Ras activity was increased by knock-out of the RasGAP, NF1 (axeB is the gene encoding NF1). Parental DdB and knock-out cells were cultivated for 48 hr in axenic medium to maximally up-regulate macropinocytosis. (K) Confocal image of macropinocytic patches in wild-type DdB and axeB null cells; (L) Quantification of the patch size in both cell types. Loss of NF1 leads to a significant increase in macropinocytic patch size.


