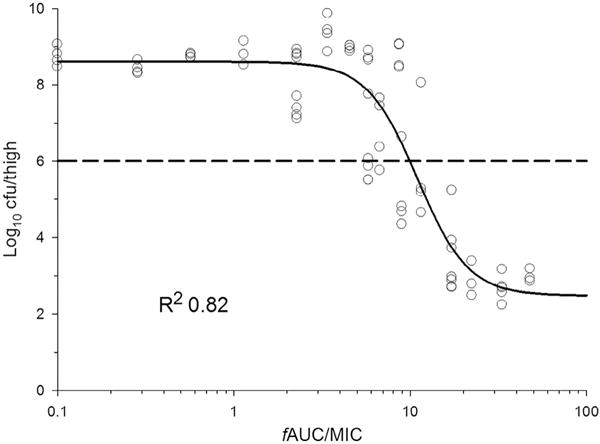
Fig. 4.

Relationship between bacterial load in the thighs of neutropenic mice at 24 h and the ratio of the area under the unbound (free) concentration–time curve to the MIC (fAUC/MIC) of colistin for Pseudomonas aeruginosa ATCC 27853. Figure adapted from Cheah et al. [23] with permission. Published 2015 by Oxford University Press.
