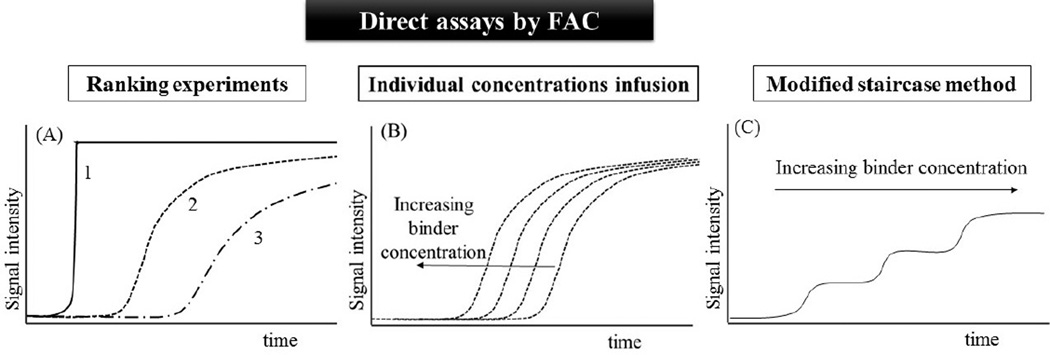
Fig. 2.
Representative illustrations of FAC direct assays for binders screening and characterization. In ranking experiments (A), a compounds mixture is continuously infused at a known concentration onto the bioaffinity column: the breakthrough curve 1 represents the elution of a non-affinity compound; the breakthrough curve 2 represents the elution of a compound with moderate affinity to the immobilized target; the breakthrough curve 3 represents the elution of the most potent binder presents in the evaluated mixture. The dissociation constant (Kd) can be accurately obtained by the infusion of individual concentrations of the binder (B), or in a single assay with the sequential infusion of the binder at increasing concentrations by the modified staircase method (C).

