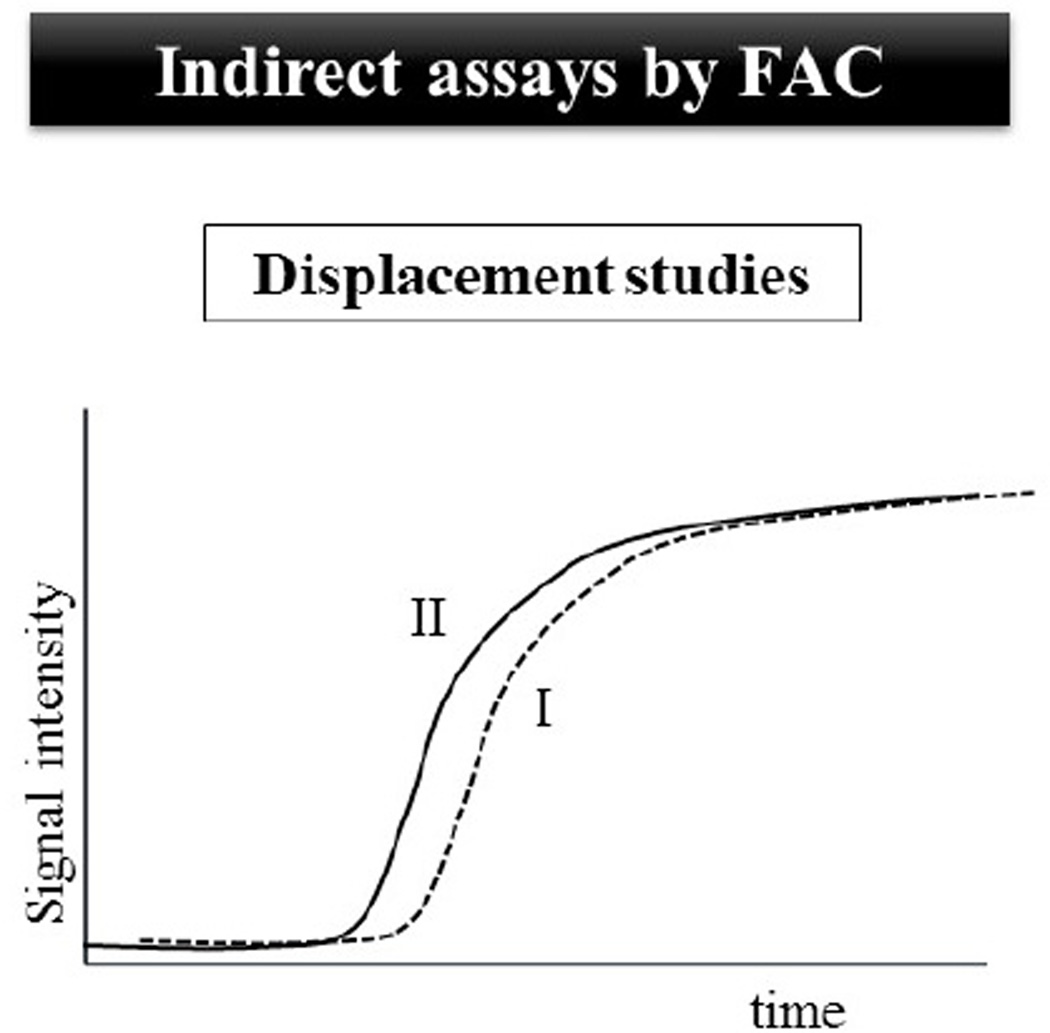
Fig. 3.
In displacement studies, the breakthrough curve of a marker (I) is monitored. When the analyzed solution contains the marker and an evaluated compound (or a compounds mixture), the breakthrough curve of the marker could be displaced (II), suggesting a direct competition between the binder and the evaluated compound (or at least one compound in a mixture) competes directly for a specific binding site.

