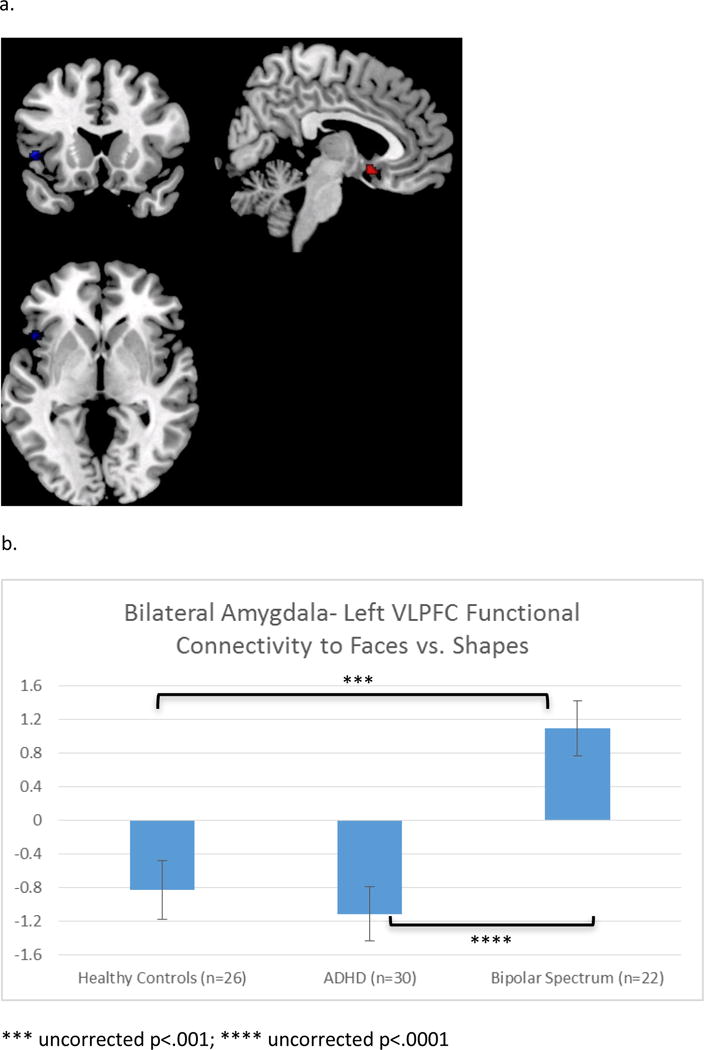
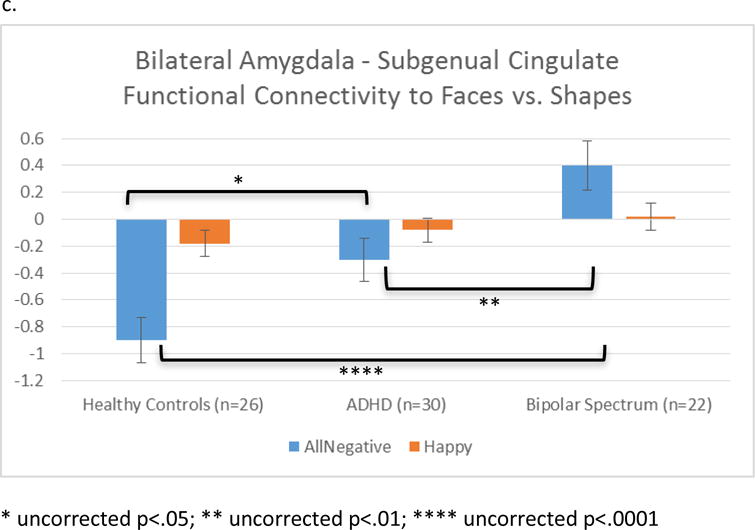
Figure 1.


a. Regions within ROI (VLPFC and ACC) that showed differential FxC across groups (voxel-wise p<.001; peak voxel FWE-corrected p<.05 within ROI). b. Overall group effect of emotions vs. shapes. More positive values on the y-axis indicate FxC increases during emotions vs. shapes. c. Condition × group interaction: Differences were significant for negative emotions, but not happy faces.
