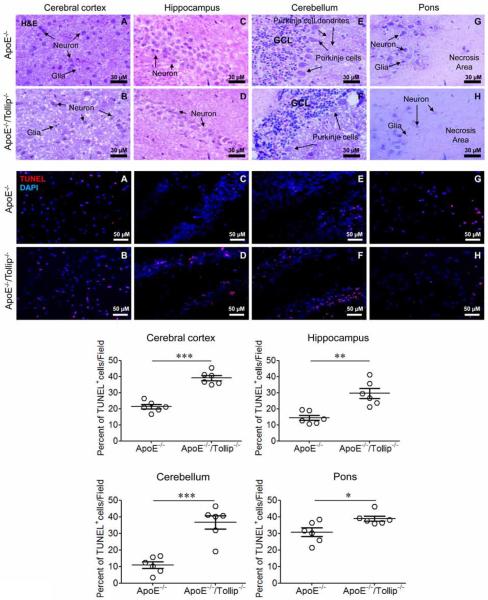
Figure 1. Tollip deficiency caused neurodegeneration in mice.
The brain tissues of ApoE−/− and ApoE−/−/Tollip−/− mice fed with HFD for 2 months were collected and analyzed by H&E (Upper panel) as well as immuno-histochemical staining (Lower panel). Upper H&E staining panels: Tollip deficiency reduced the density of neurons in Cerebral cortex, Hippocampus, Cerebellum and Pons. A–B. Cerebral cortex. Scale: 30 μm. C–D. CA1 subfield in Hippocampus. Scale: 30 μm. E–F. Cerebellum. GCL: Granule call layer. Scale: 30 μm. G–H. Pons. Scale: 30 μm. Lower immune-histochemical staining panels: Tollip deficiency increased neuronal cell death in Cerebral cortex, Hippocampus, Cerebellum and Pons. Red color: TUNEL positive; Blue color: DAPI. A–B. Cerebral cortex. C–D. CA1 subfield in Hippocampus. E–F. Cerebellum. G–H. Pons. Scale: 50 μm. Percentages of TUNNEL positive cells within various brain regions were quantified and plotted. Error bars represent SEM, N=6 mice brain tissues. * P<0.05; ** P<0.01; *** P<0.001, Mann-Whitney U test.

