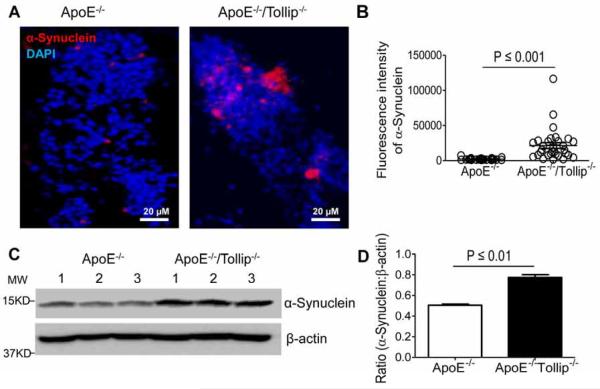
Figure 7. α-synuclein expression in the neurons of hippocampus.
The brain tissues of ApoE−/− and ApoE−/−/Tollip−/− mice fed with HFD for 2 months were collected and analyzed by immuno-histochemical staining as well as Western blot. A. Left: α-synuclein expression in the neurons of hippocampus from ApoE−/− mice. Right: α-synuclein expression in the neurons of hippocampus from ApoE−/−/Tollip−/−mice. Red color: α-synuclein, Blue color: DAPI. Scale: 20 μm. B. Fluorescence intensity of β-amyloid, N=31 viewing fields, P ≤ 0.001, Mann-Whitney U test. C. The levels of α-Synuclein and β-actin were determined by Western blotting. D. Ratio (α-synuclein: β-actin), N=3, P ≤ 0.01, student t test.

