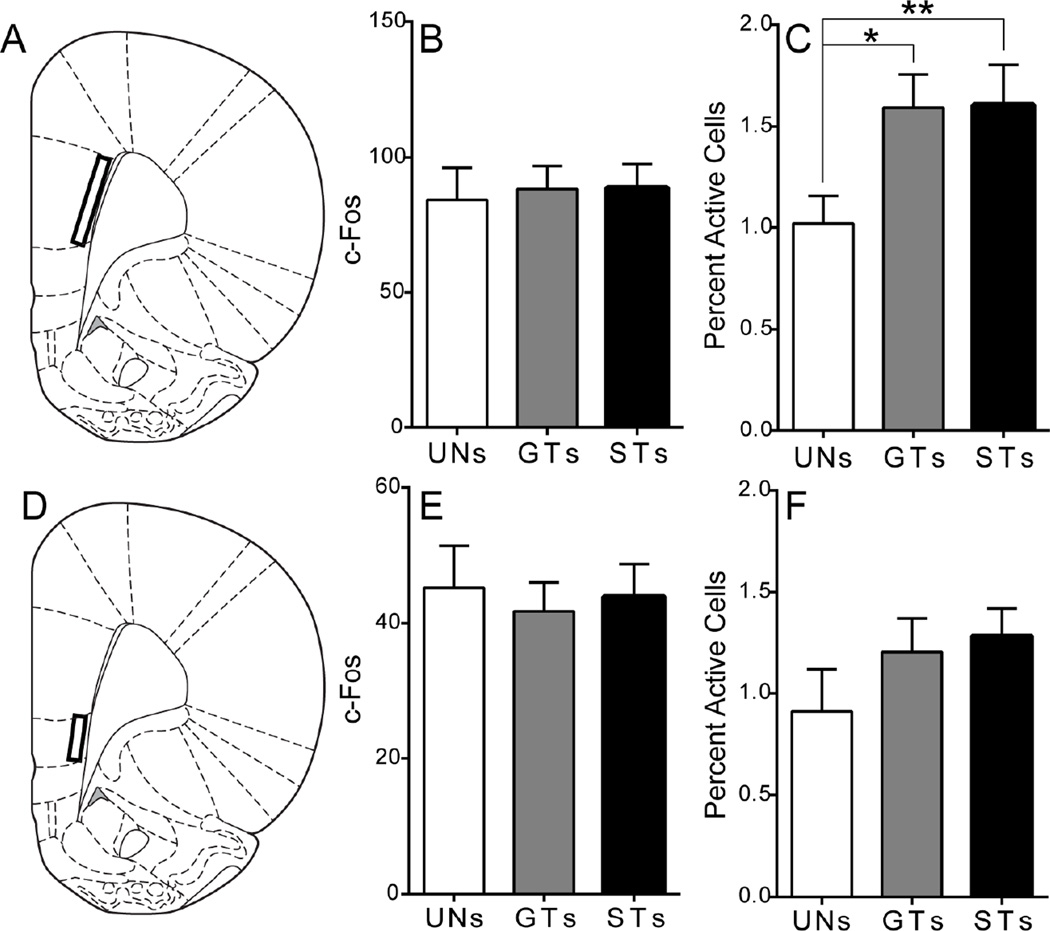
Figure 3. C-Fos expression in the medial prefrontal cortex following cue presentation.
A) Schematic coronal section (AP +3) of the left hemisphere representing the approximate area of quantification for the PrL (AP +4.2 not shown). Mean + SEM for B) overall c-Fos levels in layer 6 of the PrL and C) percent activity specifically in PVT afferents from the prelimbic cortex following stimulus presentation (UNs = 5, GTs = 8, STs = 11). There was an overall effect of Group, and Bonferroni post-hoc tests revealed that both GTs (*p = 0.02) and STs (**p < 0.01) have greater engagement of PVT afferents from the PrL compared to UNs. D) Schematic coronal section (AP +3) of the left hemisphere representing the approximate area of quantification for IL. Mean + SEM for E) overall c-Fos levels in layer 6 of the IL and F) percent activity specifically in PVT afferents from the infralimbic cortex following stimulus presentation (UNs = 5, GTs = 8, STs = 11). Percent activity was calculated as (FG + c-Fos double-labeled cells) / (total FG labeled cells). Atlas images adapted from Paxinos and Watson (2007).

