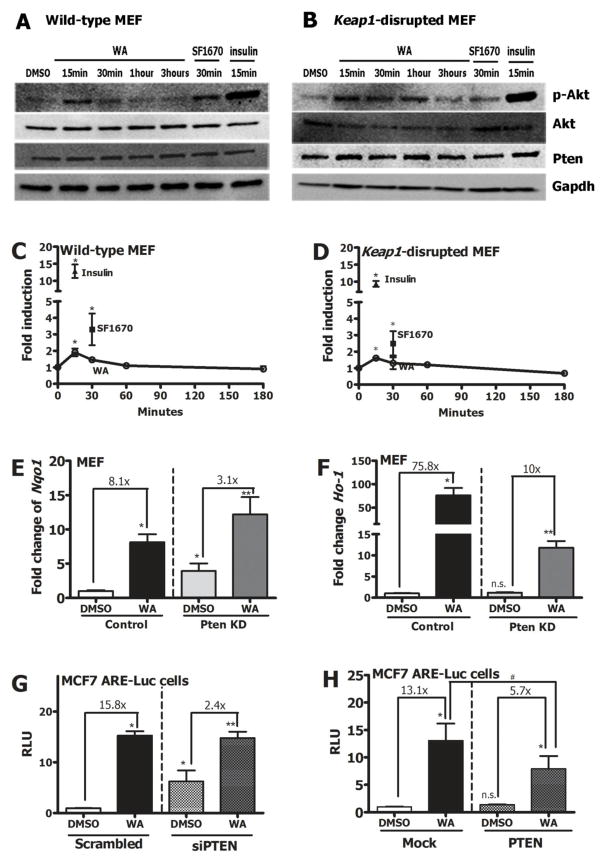
Figure 5.
Protein expression of p-Akt, Akt and Pten after 1 μM WA treatment of A) WT and B) Keap1-disrupted MEF. Quantification of p-Akt expression during WA time course in C) WT and D) Keap1-disrupted MEF. SF1670 (500 nM) and insulin (1 μM) were used as positive controls. Transcript induction of E) Nqo1 F) Ho-1 in MEFs stably transfected either control vector or shRNA against Pten (Pten KD) after a 20 hour 1 μM WA treatment. [*compared to control MEF treated with DMSO, **compared to Pten KD cells treated with DMSO, n.s.compared to control MEF treated with DMSO]. Fold change compared to DMSO control within each group is denoted as a multiple. G) Relative luciferase activity in MCF7 ARE-Luc cells treated with WA after transient transfection of either scrambled or siRNA against PTEN. H) Relative luciferase activity induction by WA in MCF7 reporter cells after cells were transfected with either mock vector or PTEN overexpression plasmid vector. [*compared to scrambled siRNA or mock vector transfected cells treated with DMSO, **compared to siPTEN or PTEN expression vector transfected cells treated with DMSO, #compared to mock vector transfected cells treated with WA, n.s.compared to mock vector transfected cells treated with DMSO]. Fold change compared to DMSO control within each group is denoted as a multiple. All values are mean ± SEM (n=3). *p<0.05.

