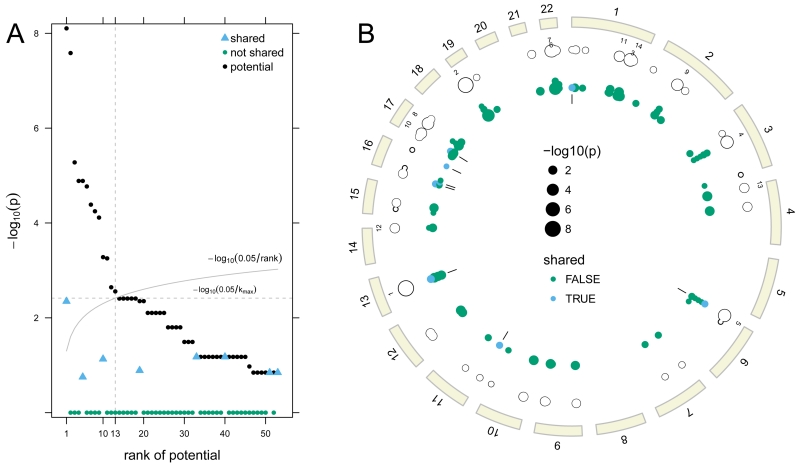
Figure 2.
Ranks of the potential p-values are plotted against the −log10 potential p-value (A). Of the 53 regions with one or more rare deletion alleles, the first 13 ranked regions have potential for a statistically significant association with oral cleft. Observed sharing probabilities for the first 13 regions were less than their potential p-values and are not statistically significant. A circos plot displays these data for each deleted region by genomic position (B). The tracks starting from the outermost ring are the ideograms (beige), the top 13 ranks of the potential sharing probabilities, the potential sharing probabilities (unfilled circles), and the contribution of each family to the potential sharing probabilities (solid circles). Families with a shared deletion are indicated in blue with tick marks on the innermost track highlighting the 8 regions with shared deletions.

