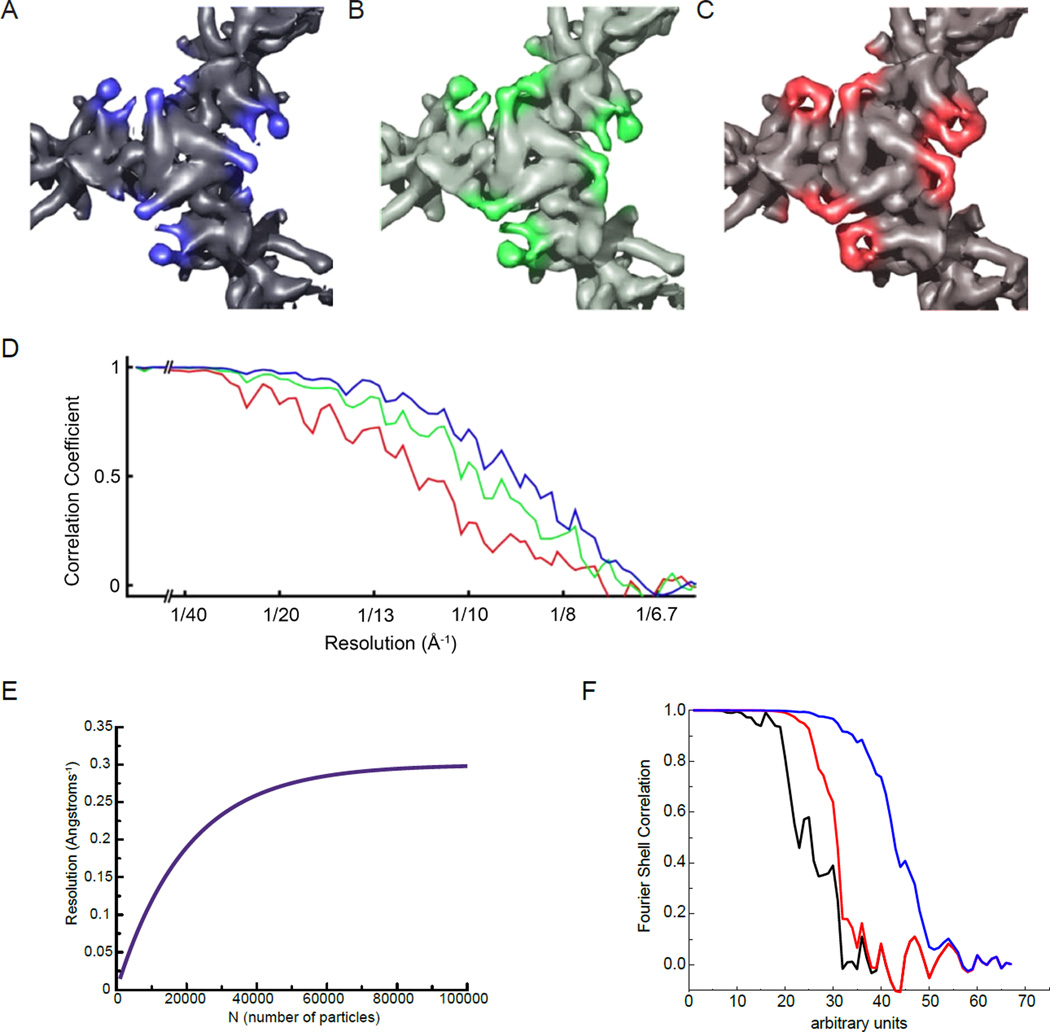
Figure 3.
Fourier Shell Correlation (FSC) can be an inaccurate measurement of resolution in cryo-EM maps. (A–D) From [53], top views of the pyruvate dehydrogenase E2 catalytic domains, contoured to the same sigma levels, reconstructed using the best 963 (A), 395 (B) or 139 (C) particles. Although features of the map become better resolved as fewer, better particles are used, the reported FSC resolution (D) decreases. Colors of the FSC plots in (D) correspond to map colors in (A–C). (E) An idealized curve for resolution as a function of sample size N, which tends to follow a log-linear relationship [54]. (F) An actual FSC curve between two independent half-map reconstructions of a helical polymer is shown in black (the scale of the abscissa is arbitrary). In red the same FSC is computed, but after adding an artifact to the reconstruction, a Gaussian cylinder of density along the axis with a standard deviation in the radius of the cylinder of 2 pixels. The FSC is improved (it is shifted to the right) and at high resolution the black and red curves are completely superimposed. In the blue curve the Gaussian cylinder is even narrower, with a standard deviation in radius of 1.5 pixels, which greatly improves the overall FSC and still matches the “true” FSC (the black curve) at the highest resolution.

