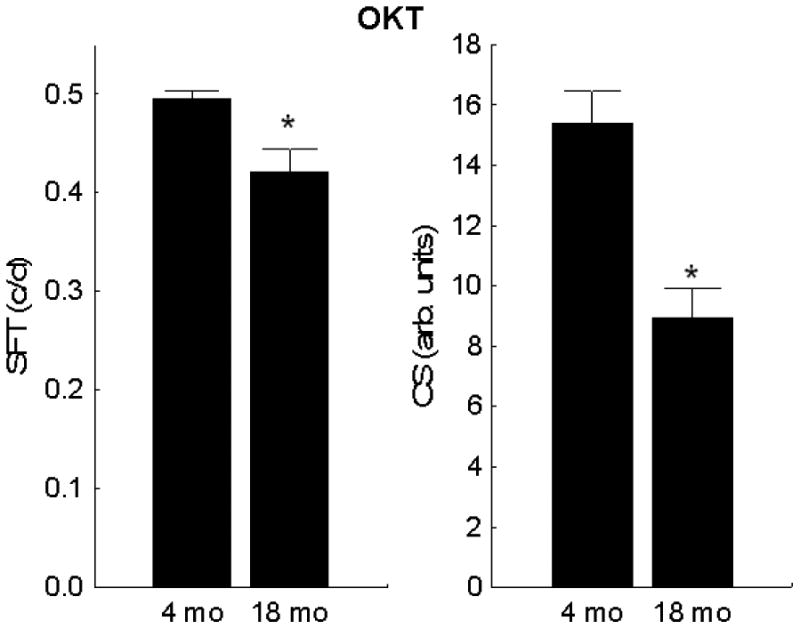
Figure 1. Visual performance of UM-HET3 mice declines with age.

Visual indices evaluated for young (n = 8) and old (n = 8) mice were spatial frequency threshold (left panel) and presumptive peak of the contrast sensitivity curve (right panel). Significant differences (p < 0.05) from 4 mo (*) are noted. Error bars represent SEM.
