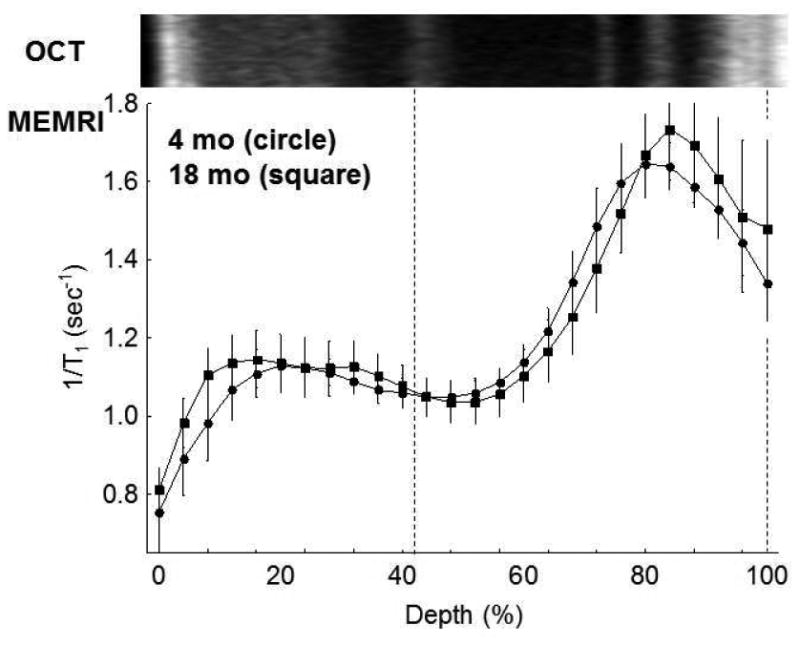
Figure 2. Functional rod cell LTCC topography as measured by MEMRI does not increase with age.

Summary of central retinal MEMRI as a function of retinal depth in dark adapted 4 mo (n = 5) and 18 mo UM-HET3 (n = 5) mice. Approximate location of two anatomical landmarks are indicated by dotted lines (i.e., anterior aspect of the outer plexiform layer (left) and retina/choroid border (right)). Profiles are spatially normalized to dark adapted retinal thickness (0% = vitreous/retina border, 100% = retina / choroid border) and spatially calibrated against a representative optical coherence tomography image from a 4 mo mouse; as shown in Figure 4, OCT and retinal thickness does not change with age (see text). Error bars, SEM.
