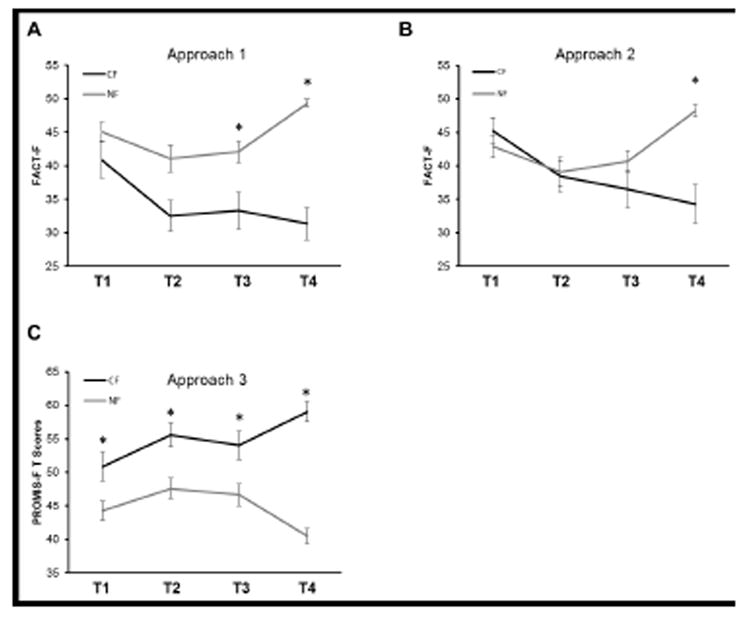
Figure 3.

Fatigue score changes of men with prostate cancer as measured at baseline (T1; prior to EBRT), midpoint (T2; day 19-21), endpoint (T3; day 38-42), and one year after EBRT completion (T4). Subjects were subdivided into chronic fatigue (CF) and non-fatigue (NF) groups based on three phenotyping approaches: Approach 1: a FACT-F 43-point cut off at one year (a), Approach 2: 3-point change in FACT-F score from baseline to one-year after EBRT (b), and Approach 3: PROMIS-F a T-score greater than 50 at one year cut off (c) criteria. (a) 38.2% of subjects fell into the CF category using the FACT-F 43-point cut-off criterion (F3,33 = 5.4, p < 0.01). (b) 34.5% of subjects had a change of 3 points and greater from baseline to one year after EBRT (F3,33 = 12.3, p < 0.01). (c) Chronic fatigue was experienced in 34.3% of subjects based on PROMIS >50 T-score cut-off criterion (F3,34 = 8.3, p < 0.01). Mauchly’s test of sphericity was not significant in the repeated-measures ANOVA models (p > 0.1) indicating that the assumption of sphericity was not violated in any of the models. Repeated measures ANOVA and post hoc non-directional Student’s t-test with Bonferroni corrections for multiple comparisons were performed to analyze fatigue changes over time with fatigue levels defined as the between subjects factor and time as the within subjects factor. * Indicates significant differences between CF and NF subjects (p<.05).
