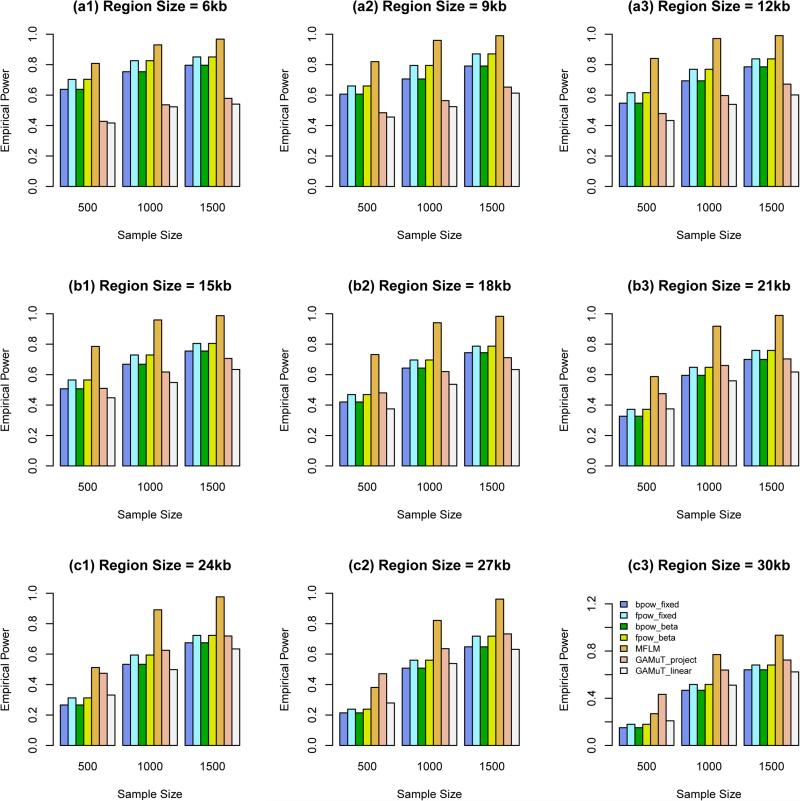
Figure 6.
The empirical power of the approximate F-distributed tests of the additive models of MANOVA (1) and MFLM (5) and (7) based on Pillai-Bartlett trace and GAMuT at α = 2.5 × 10⁻⁶ for six traits and moderate correlation, when all causal variants are rare, 20%/80% causal variants have negative/positive effects for each of six traits, and 5% variants are causal. The order of B-spline basis was 4, the number of B-spline basis functions was K = Kβ = 15, and the number of Fourier basis functions was K = Kβ = 21.

