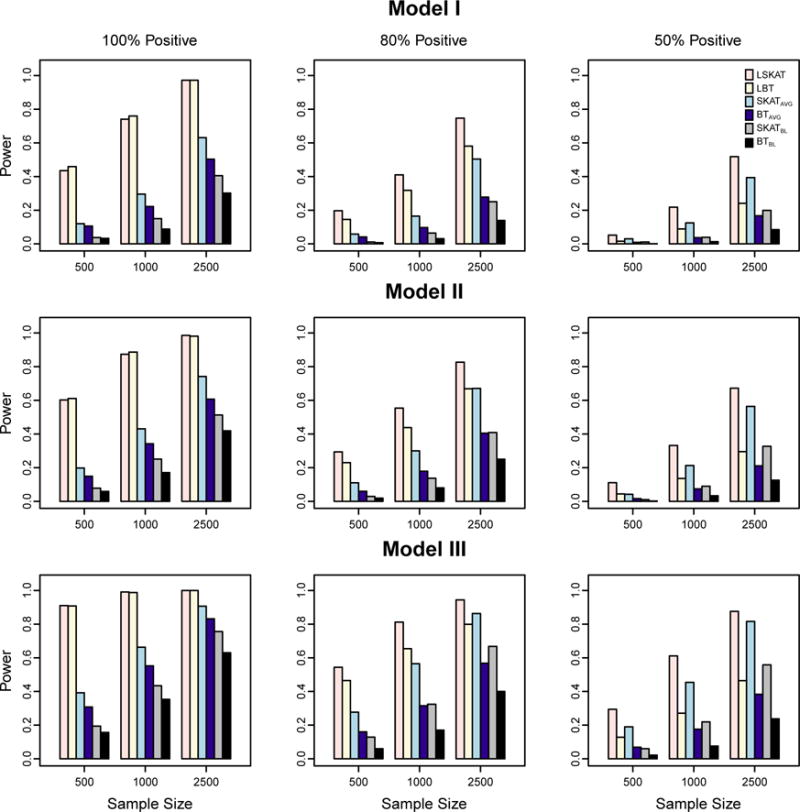
Figure 1.

Empirical power of LSKAT, LBT, SKATAVG, BTAVG, SKATBL, and BTBL in Models I–III when 30% of variants are causal. Empirical power is based on 1000 simulated replicates at eight time points with α = 10−5. Total sample sizes considered are 500, 1000, and 2500. From the left to right columns, the plots illustrate settings in which the coefficients for the causal variants are 100% positive, 80% positive, and 50% positive.
