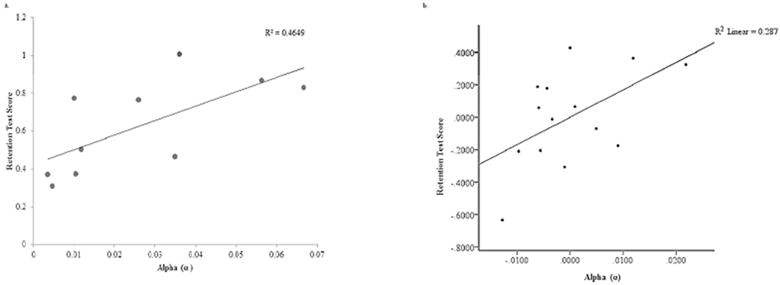
Figure 4.

a and b: a. Relationships of RTS and Alpha (α) during repeated sequence performance in healthy individuals (HC Group) (p < 0.05). b. Partial plot generated by hierarchical regression analysis for Repeated Sequence Performance. The relationship between RTS and Alpha (α) was significant after accounting for WMFT rate for the hemiparetic limb in individuals with chronic stroke (ST Group) (p < 0.05).
