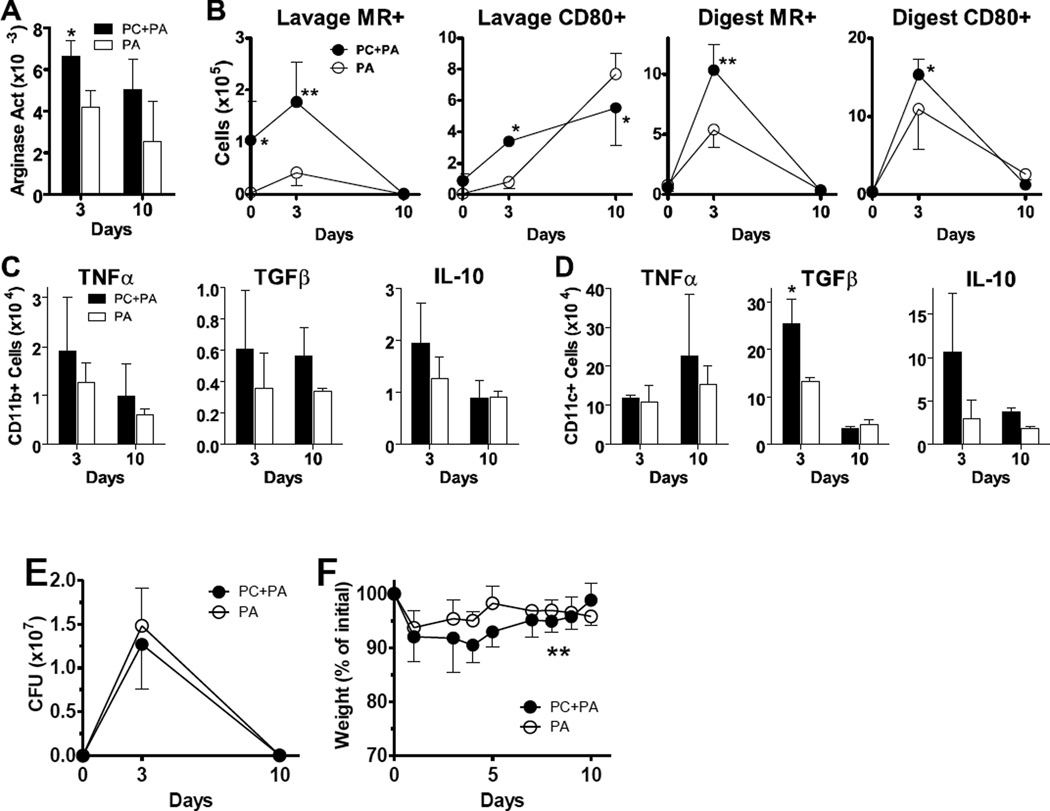
FIG 5.
Pneumocystis infection alters macrophage responses to subsequent Pseudomonas aeruginosa infection. Normal C57Bl/6 mice were infected with 1x10⁷ Pneumocystis (PC) nuclei (or sham infection) by intratrachael (i.t.) instillation and then challenged with 2x10⁵ CFU P. aeruginosa (PA)-laden agarose beads it. 14 days later and euthanized at subsequent timepoints. Cells were isolated from the alveolar space via lung lavage, and whole lungs were digested to create single cell suspensions. (A) Arginase activity in lung digest was determined by measurement of the conversion of arginine into urea and standardized to total protein. (B) Cells isolated from lung lavage and lung digest samples were identified as CD11b+ and stained for MR and CD80 protein expression and analyzed by flow cytometry. (C, D) The number of CD11b+CD11c− (panel C) and CD11b− CD11c+ (panel D) cells producing TNFα, TGFβ, and IL-10 were measured by intracellular cytokine staining and flow cytometry. Lung digest preparations were incubated with PMA, ionomycin, and brefeldin A as described and surface stained for CD11b and CD11c. Following fixation they were stained for intracellular up-regulation of TNFα, TGFβ, and IL-10. (E, F) P. aeruginosa clearance kinetics and mouse weights are shown over time for data pooled from all experimental replicates. Means ± standard deviations (or SEM for P. aeruginosa CFU values) are reported for groups of 3–4 mice per timepoint per condition (or pooled as noted), and are representative of 2 experimental replicates. Statistically significant differences between treatment groups at each timepoint are denoted as follows: *, P < 0.05; **, P < 0.01 by two-way ANOVA and Bonferroni post test.

