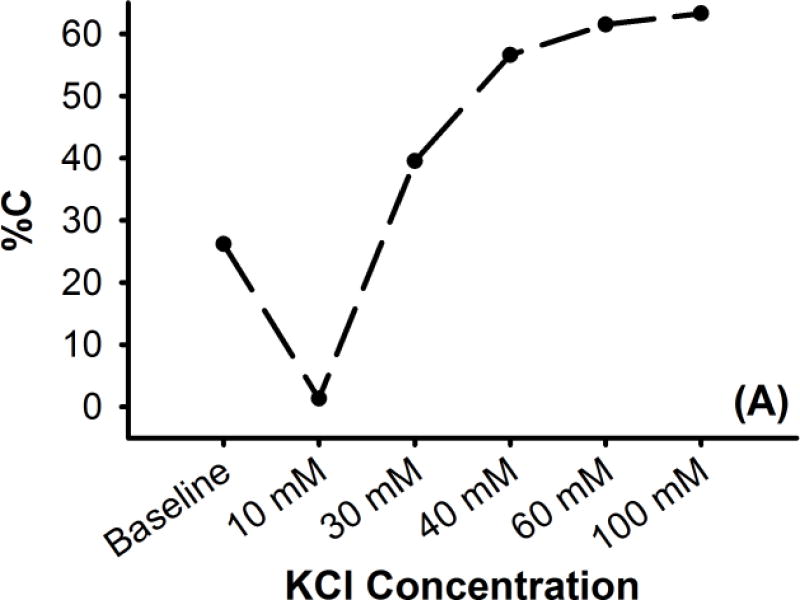
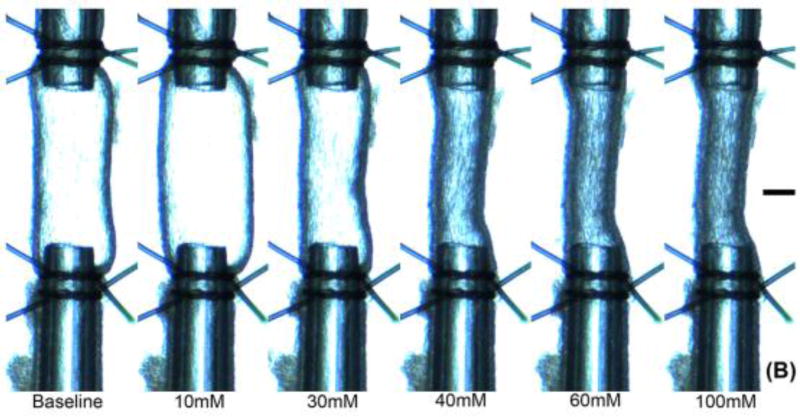
Figure 1. Representative K+ dose response for a rat MCA sample (A) in terms of percent contraction (%C), and (B) as viewed by the camera.
Characteristic biphasic response exhibits dilation to small increases of K+ and contraction to high K+ concentrations. Baseline KCl concentration is 4.7 mM. Scale bar at image right is 100 μm


