
Figure 2.
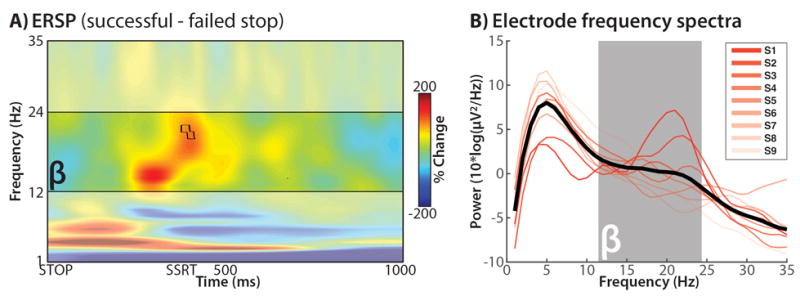
A) Full spectrum ERSP data from the LFP-only phase (no TMS; the bipolar STN channels underlying this figure were selected from the simultaneous LFP-TMS data to perform the main analysis in Figure 3). Depicted is the difference between successful and failed stop trials, time-locked to the stop-signal (STOP); red: successful > failed, blue: failed > successful. Black outline: p < .00417. B) Individual channel power spectra for each selected channel. Note the uptick in beta power in each individual channel.