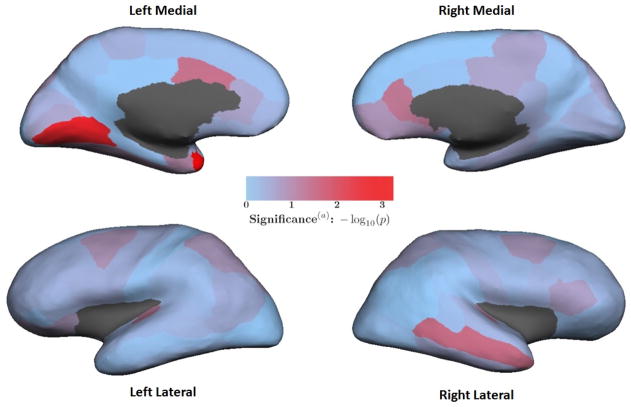
Figure 2. Heat map of each ROI’s significance under JVAR test.
Colors represent p-values from the JVAR test for each ROI comparing subjects with a learning problem diagnosis (n=37) and without a LP diagnosis (n=442) in the PING sample (n=479). Red indicates greater significance. (a) The p-values are not adjusted for multiple comparisons. The p-values from the JVAR tests for all 66 ROIs are listed in Table S9.

