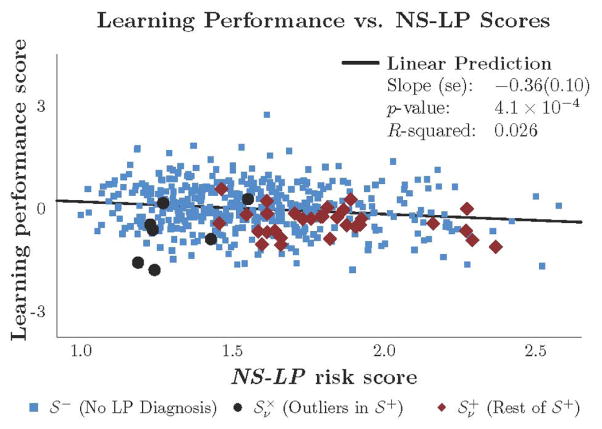
Figure 3. Learning performance scores versus NS-LP scores.
The blue, black, and red markers represent subjects in subgroups denoted by S− (n=442), , and respectively. The and subgroups respectively contain outliers and non-outliers in S+ (n=37) based on outlyingness of subjects, with respect to neuroanatomical measurements, threshold v = 0.01. Methods section describes how outliers are identified. Regression results are over the PING sample (n=479) and based on Model (A) specified in Table 2.

