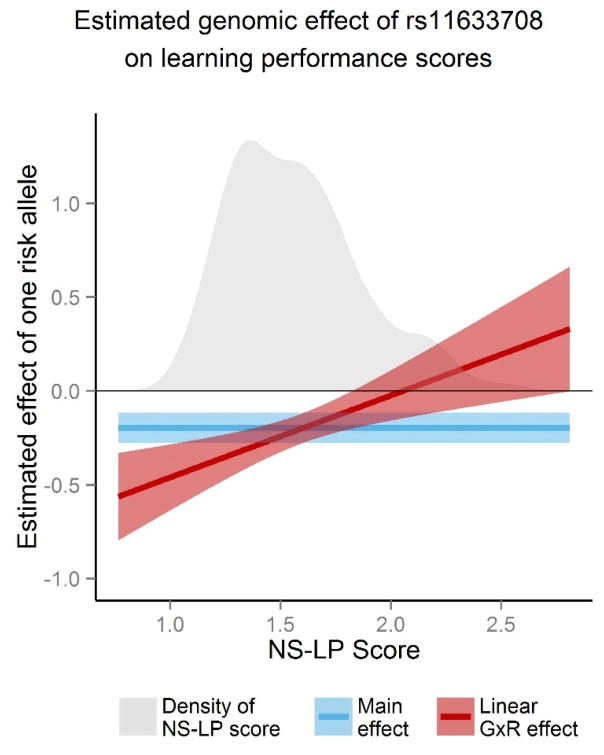
Figure 5. Estimated effect of rs11633708 on learning performance as function of NS-LP risk score.
The SNP rs11633708 on AGBL1 (chromosome 15) was the most significant in a GWAS of learning performance scores over the PING sample (n=479). The vertical axes represents estimated effect one additional risk allele of rs11633708 on learning performance scores (μ= 0, σ= 0.67). Lines and shaded regions represent estimated effects and their 95% confidence intervals in three models. Blue represents the main effect model, which does not rely on NS-LP risk scores. Red represents the G×R model presented in the genomic results section. Estimates and standard errors in the G×R model are a function of NS-LP scores. Standard errors there were evaluated from the covariance matrix of estimates in the respective linear regression models. The gray region in both plots is the empirical density of NS-LP scores and is at scale with the vertical axis.

