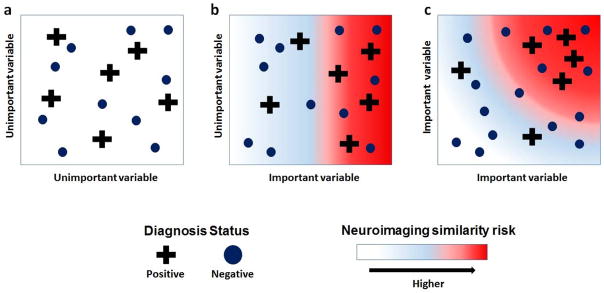
Figure 6. Illustration of neuroimaging similarity for a diagnosis.
Two subgroups of subjects are formed on the basis of observed diagnosis. Plus signs represent S+ (positive diagnosis) and dots represent S− (negative diagnosis). Along important variables, S+ has greater level of within-group similarity (homogeneity) relative to S-. Along unimportant variables, the level of within-group similarity for S+ and S− are roughly equal. Background colors represent subjects’ continuous level of along respective axes. Each figure represents bivariate comparisons between variables. Background color represent continuous level to neuroimaging similarity with S+ in bivariate setting. (a) Axes represent two unimportant variables where neuroimaging similarity risk cannot be detected. (b) Respective axes are important and unimportant variables. Neuroimaging similarity risk increases only along axis for important variable. (c) Axes represent two important variables, where neuroimaging similarity to S+ is with respect to multivariate distances.

