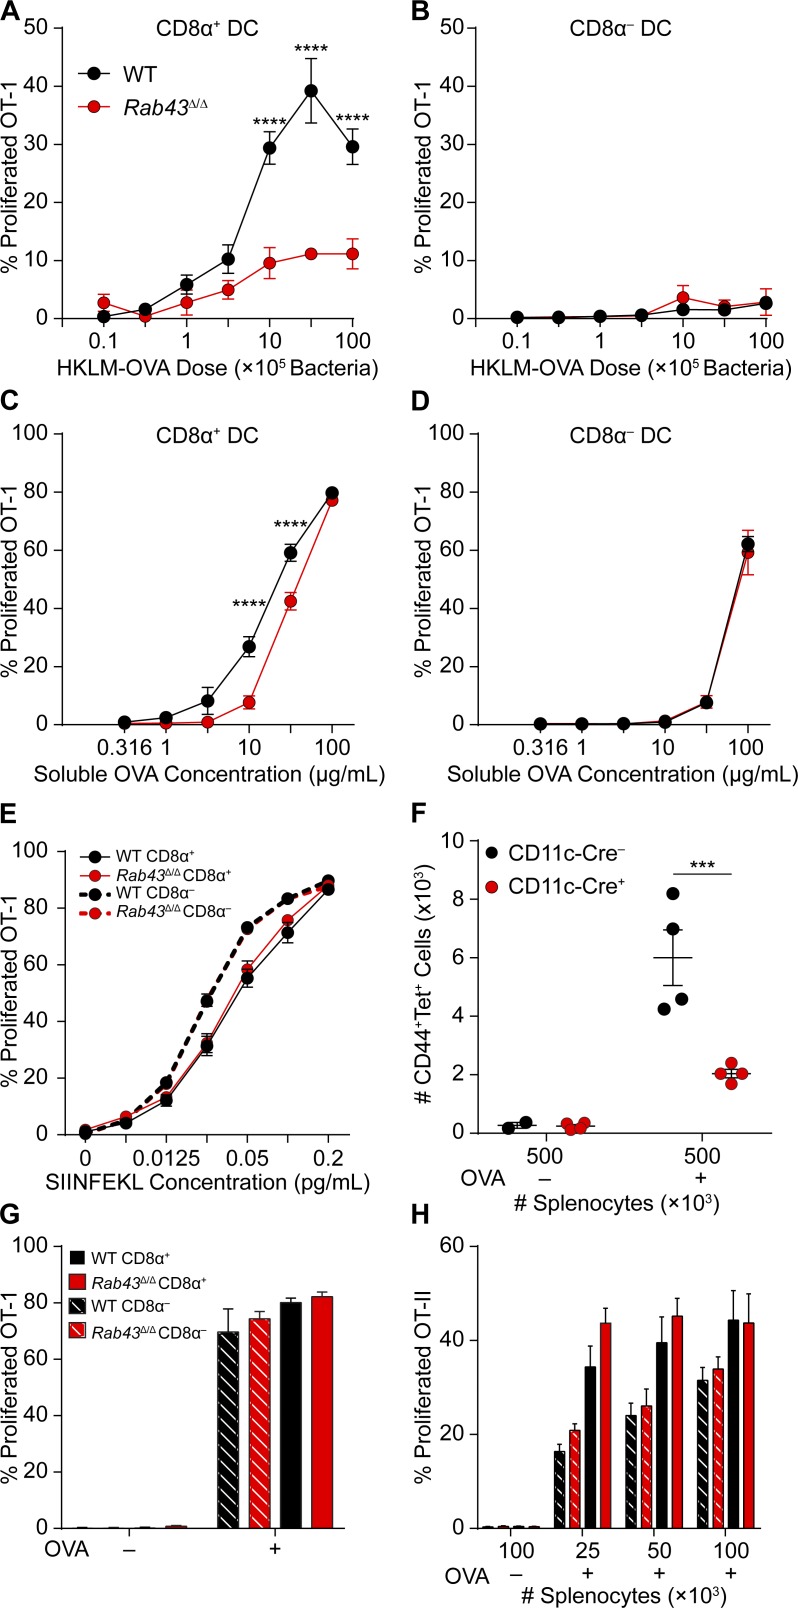
Figure 4.
CD8α+ DCs from Rab43Δ/Δ mice are defective in cross-presentation of cell-associated and soluble antigens. (A and B) Sorted CD8α+ (A) or CD8α− (B) DCs from WT (black) or Rab43Δ/Δ (red) B6 mice were cultured for 3 d with CFSE-labeled OT-I T cells and different doses of HKLM-OVA and assayed for OT-I proliferation and activation (CFSE−CD44+). (C and D) Sorted CD8α+ (C) or CD8α− (D) DCs from WT (black) or Rab43Δ/Δ (red) mice were cultured and analyzed as in A with various doses of soluble OVA as antigen. (E) Sorted CD8α+ (continuous lines) or CD8α− (dashed lines) DCs from WT (black) or Rab43Δ/Δ (red) mice were cultured and analyzed as in A with the indicated amounts of SIINFEKL peptide as antigen. (F) Rab43f/f-CD11cCre− (black) or Rab43f/f-CD11cCre+ (red) mice were injected with the indicated numbers of PBS (OVA−)- or OVA (OVA+)-loaded irradiated MHCI TKO splenocytes and analyzed 8 d later for the number of Kb SIINFEKL tetramer+ (tet+) T cells that were CD44+CD62L−. Each dot represents cells obtained from one mouse. (G) Sorted CD8α+ (solid) or CD8α− (dashed) DCs from WT (black) or Rab43Δ/Δ (red) mice were osmotically loaded with OVA, cultured, and analyzed as in A. (H) Sorted CD8α+ (solid) or CD8α− (dashed) DCs from WT (black) or Rab43Δ/Δ (red) mice were cultured for 3 d with CFSE-labeled OT-II T cells and irradiated splenocytes osmotically loaded with OVA. T cells were assayed for proliferation and activation (CFSE−CD44+). All data are displayed as mean ± SEM from at least two independent experiments. Statistics were analyzed using two-way ANOVA. ***, P < 0.001; ****, P < 0.0001.

