Figure 3.
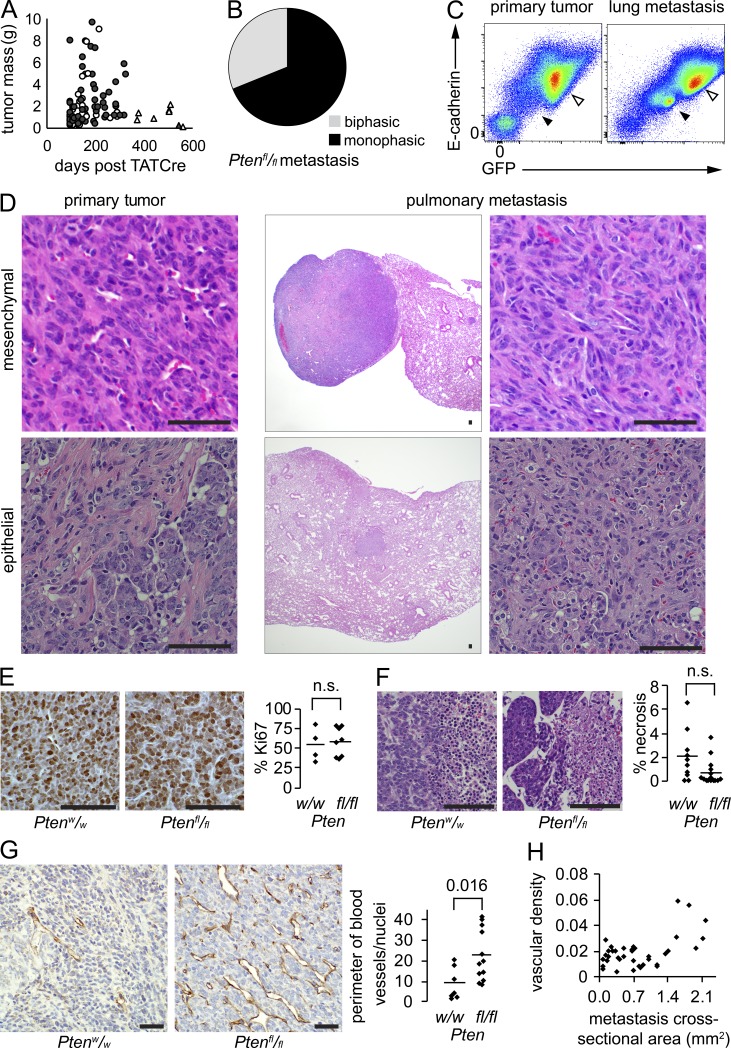
Pten silencing drives increased vascularity in synovial sarcoma. (A) Plot of tumor mass at harvest against time elapsed after TATCre injection into mice bearing conditional SS18-SSX and either Ptenw/w (triangles) or Ptenfl/fl (circles). Filled shapes indicate tumors with associated histologically detected metastasis. (B) Pie chart demonstrating histological subtype fractions for metastatic tumors in hSS;Ptenfl/fl mice (n = 59). (C) Flow cytometry of a primary tumor and lung metastasis stained with E-cadherin and analyzed for intrinsic GFP expression. Tumor population (open arrow) and endothelial cells (filled arrow) both express higher levels of E-cadherin than the immune infiltrates (lower left). (D) Example photomicrographs of tumors with retained histological appearance between primary tumor and metastasis. (E) Example anti–Ki-67 immunohistochemistry photomicrographs and chart of proliferative indices for SS18-SSX-induced tumors in each Pten genotype (student’s t test). (F) Example H&E photomicrographs of necrosis (right side of each) identified in tumors and graph of the mean necrotic area per tumor cross section by histology (Student’s t test). (G) Example anti-CD31 immunohistochemistry photomicrographs demonstrating vascular density in hSS tumors arising with wild-type or silenced Pten. Graph presents mean vascular density in primary tumors of each genotype (Student’s t test). (H) Plot of vascular density indicated as vessel perimeter per cross-sectional area against cross-sectional area of each metastasis in hSS;Ptenfl/fl mice. Bars, 50 µm.

