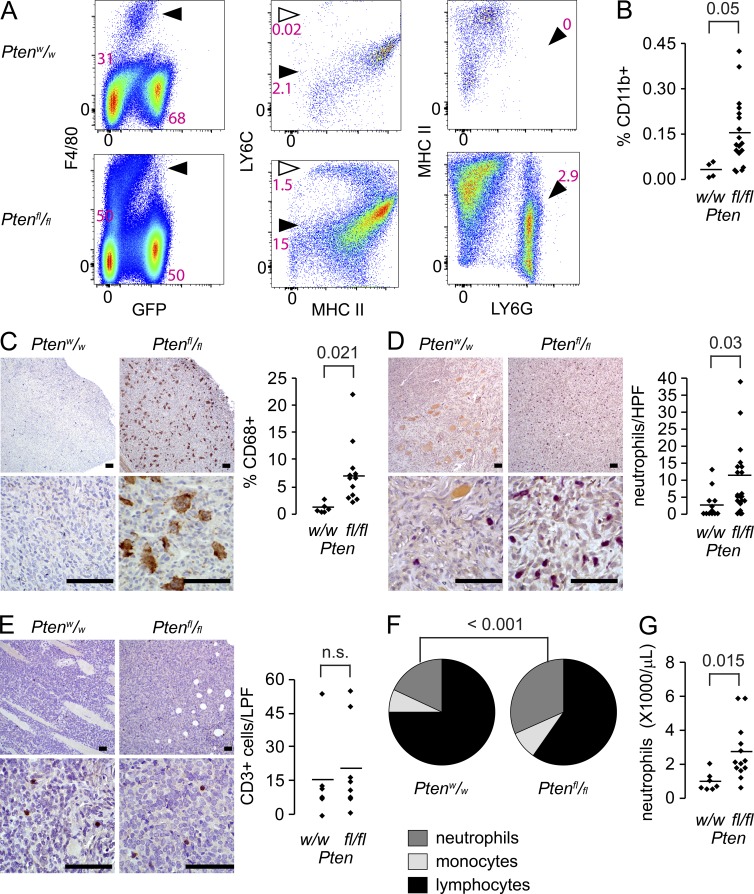
Figure 5.
Pten silencing associates with increased infiltration of myeloid-derived cells. (A) Example flow cytometry comparing an hSS;Ptenw/w tumor (top) to an hSS;Ptenfl/fl tumor (bottom) for F4/80+/GFP− monocytes/macrophages (arrowhead, left plot), their MHCII+/Ly6Chigh newly recruited monocyte (open arrow, middle plot) and MHCII+/Ly6Cmid tissue macrophage (filled arrowhead, middle plot) subpopulations, and Ly6C+/Ly6G+ neutrophils (arrowhead, right plot). (PE, phycoerythrin; APC, allophycocyanin; PerCP, perdinin chlorophyll protein). (B) Graph comparing the percent of infiltrating CD11B+ cells in hSS tumors of each Pten genotype (Student’s t test). (C) Representative low and high power photomicrographs and quantitation of CD68+ monocytes/macrophages (brown) by immunohistochemistry in hSS;Ptenw/w and hSS;Ptenfl/fl tumors (Student’s t test). (D) Representative low and high power photomicrographs and quantitation per high power field (HPF) of Leder cytochemically stained neutrophils (magenta) in hSS;Ptenw/w and hSS;Ptenfl/fl tumors (Student’s t test). (E) Representative photomicrographs of CD3 immunohistochemistry in hSS;Ptenw/w and hSS;Ptenfl/fl primary tumors and an associated graph demonstrating low and equivalent numbers of CD3+ lymphocytes (Student’s t test). (F) Pie charts presenting the mean fractions of neutrophils, monocytes, and lymphocytes in the peripheral blood of morbid tumor-bearing hSS;Ptenw/w and hSS;Ptenfl/fl mice (n = 7 and 13, respectively; Chi-squared test). (G) Graph of peripheral blood neutrophil counts in morbid tumor-bearing hSS;Ptenw/w and hSS;Ptenfl/fl mice (Student’s t test). Bars, 50 µm. Graph points present individual tumors; bars present means.

