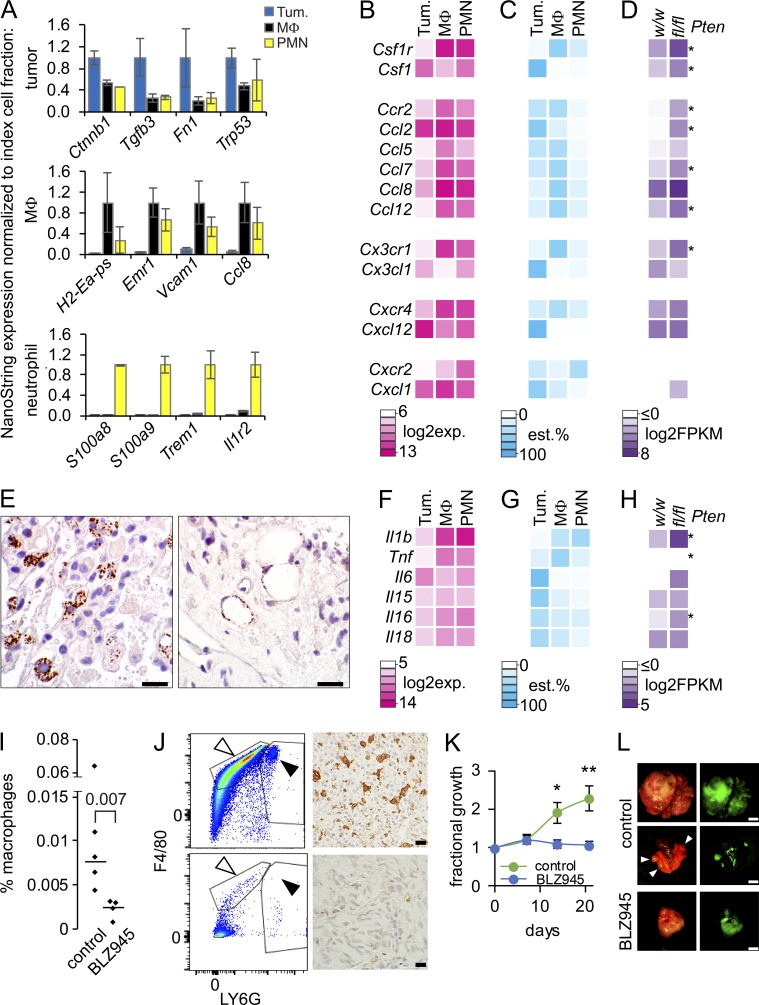
Figure 6.
Pten silencing enhanced synovial sarcoma cells express Csf1. (A) Nanostring expression graphs of marker genes for each cellular fraction from whole hSS;Ptenfl/fl tumors, with expression normalized to that in each index cell type (MΦ, macrophage; PMN, polymorphonuclear cell or neutrophil). (B) NanoString expression levels heat map of macrophage recruitment receptors and their corresponding ligands in each source cell fraction of tumors. (C) Heat map of the estimated (est.) percent contribution to each gene’s overall expression in the tumor from each source cell fraction, generated by normalizing the NanoString expression by the mean numerical fraction of cells. (D) Heat map of the mean log2-transformed FPKM expression level for each gene in hSS;Ptenw/w and hSS;Ptenfl/fl tumors. *, P < 0.05. (E) Photomicrograph of immunohistochemistry with an anti-pCSF1R antibody, demonstrating macrophages (left) and endothelial cells (right) in a tumor section actively receiving and transducing CSF1 signal. Bar, 10 µm. (F–H) Heat maps as in B–D, but of neutrophil stimulants. Notably, G-CSF (Csf3) and GM-CSF (Csf2) were not significantly expressed by tumors in whole transcriptome profiling, with or without Pten silencing. (I) Graph comparing the percent macrophage population in control tumors or tumors treated with BLZ945. Statistical test did not include outlier in control with high percentage of macrophage (Student’s t test). (J) Representative flow cytometry demonstrating a decreased population of macrophages in the BLZ945-treated tumors (bottom) compared with control (top). Photomicrograph of immunohistochemistry with an anti-CD68 antibody, showing a decrease in macrophages in BLZ945 treated tumors (bottom) compared with control (top). (K) Graph of percent tumor growth over baseline for 21 d of treatment with or without 200 mg/kg of BLZ945. *, P < 0.05; **, P < 0.01. n = 5 per group, Student’s t test. (L) Examples of photomicrographs of control tumors and BLZ945-treated tumors with corresponding GFP expression demonstrating the twofold increase in control tumor volume. Middle panel is control lungs with grossly visible metastases (arrowheads). Bars: (black) 10 µm; (white) 5 mm.

