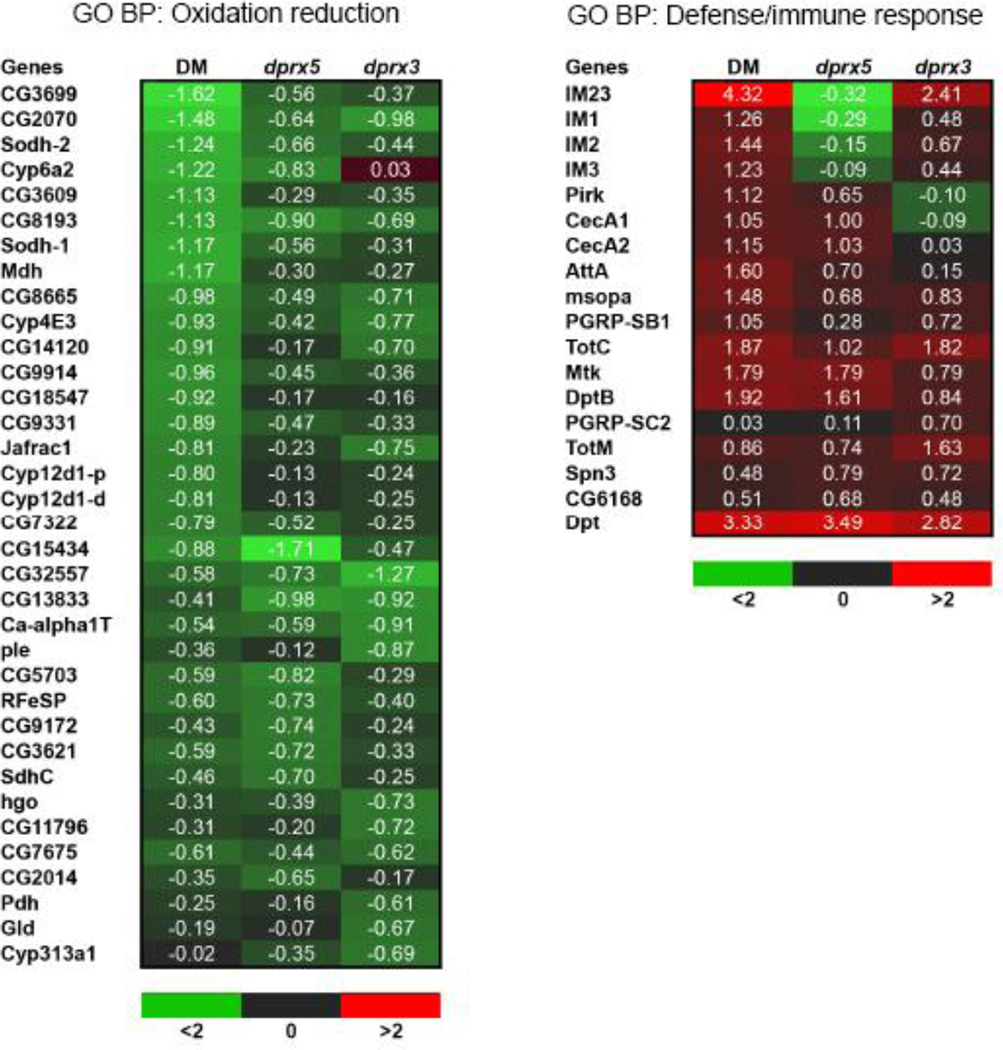
Figure 3. Heat map demonstrating changes in expression of the defense/immune-related (right) and oxidation/reduction-related genes (left).
The results are expressed as fold ratio of the log2 gene expression values in the following comparisons: DM vs control (DM), dprx3 vs control (dprx3) and dprx5 vs control (dprx5). The red color depicts an increase in expression level of the mutants relative to control, and green represents a decrease. Shown is GO Biological Process (BP).

