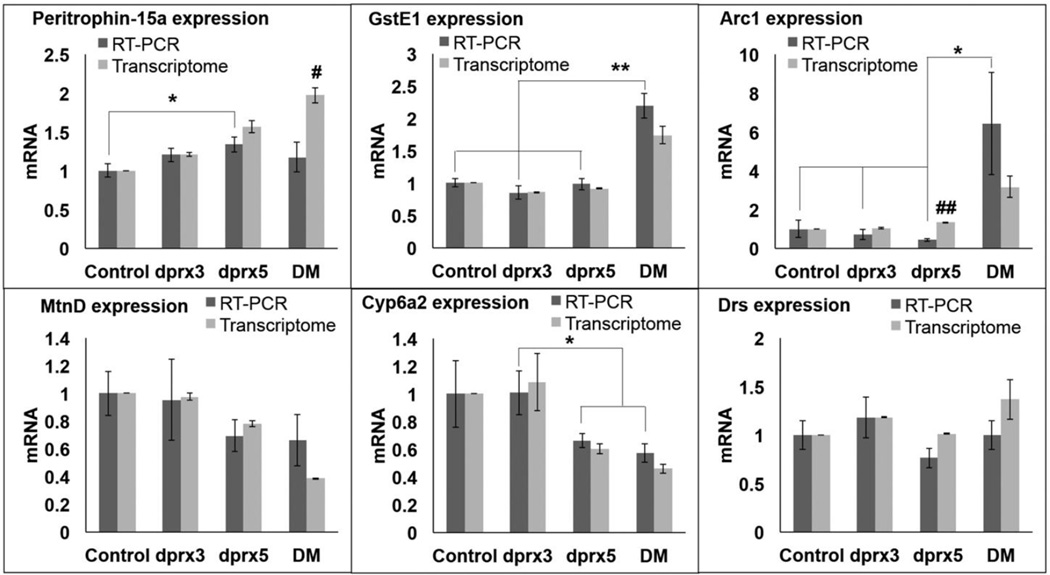
Figure 4. Validation of transcriptome analysis by qRT-PCR.
Analysis of gene expression in control and the double (DM) and single mutants (dprx5 and dprx3) has been done in flies of the same chronological age (12–13 days). Primers for gene amplification are listed in Suppl. Table 1. Averages and SEM from at least tree independent samples are shown. Asterisks denote statistically significant differences obtained in RT-PCR analysis (*P<0.05; **P<0.01). Differences between values obtained by RT-PCR and transcriptome data are shown by # (P<0.05) and ## (P<0.01).

