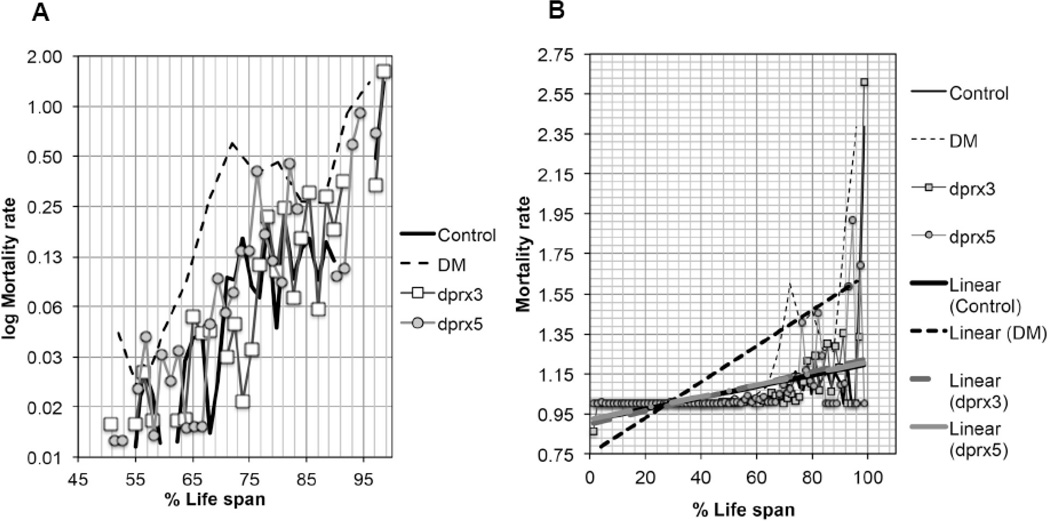
Figure 6. Changes in mortality rate in the double (DM), the single mutants (dprx5, dprx3) and control.
Mortality rate was calculated as reported (67), and plotted on a log2 scale (A) as a function of physiological age (% of life span). Approximately 100–125 flies were used for each fly line. B, The linear trend lines defined for mortality rates for each group of flies, are shown to demonstrate the divergence between the DM and the single mutants and controls.

