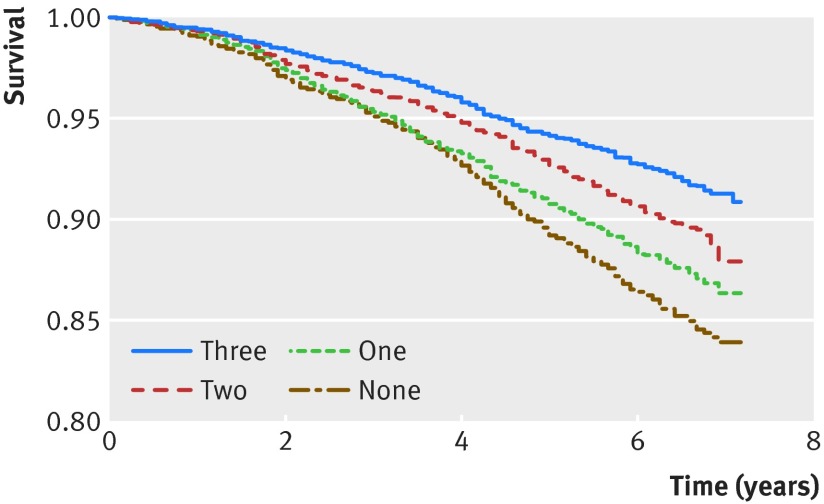
Fig 1 Kaplan-Meier survival curve for all cause mortality according to the number of reports (none to three) on which participants in the English Longitudinal Study of Ageing cohort reported higher enjoyment of life (n=9365). Horizontal axis=time in years from the final assessment of enjoyment in 2006

An official website of the United States government
Here's how you know
Official websites use .gov
A
.gov website belongs to an official
government organization in the United States.
Secure .gov websites use HTTPS
A lock (
) or https:// means you've safely
connected to the .gov website. Share sensitive
information only on official, secure websites.
