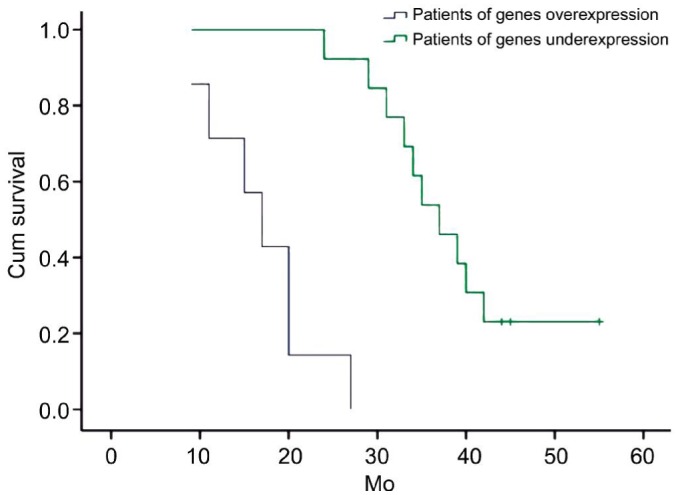
Figure 5. Kaplan-Meier survival curves according to the level of genes including SLAMF7, CCL22, KRT10, FXYD3 and ABCC2.

(Green: Patients of genes underexpression; Blue: genes overexpression, P=0.000) as the patients of genes overexpression show a much more relapsing clinical course (Median survival time: 72.0 vs 39.1mo, respectively).
