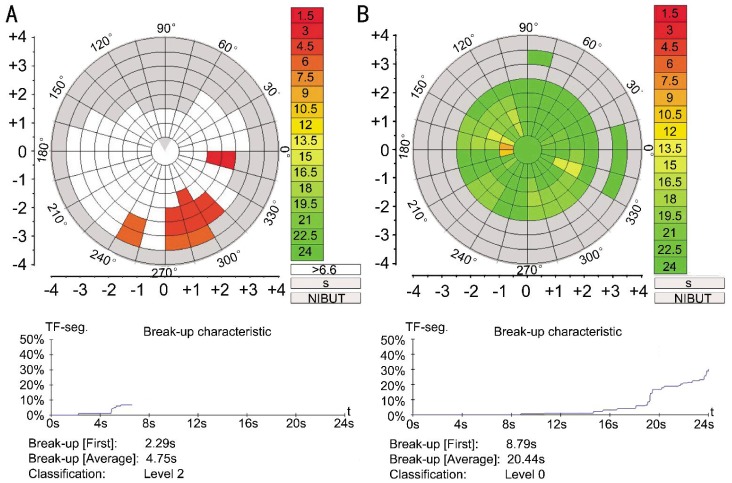
Figure 1. Output of the NI-BUT measurement by Keratograph 5M system.
The NI-BUT is automatically marked with different colors in the video. The bar chart on the right shows the corresponding relation between color and time. The first NI-BUT in a subject in DM group was 2.29s (A), whereas that in control group was 8.79s (B).

