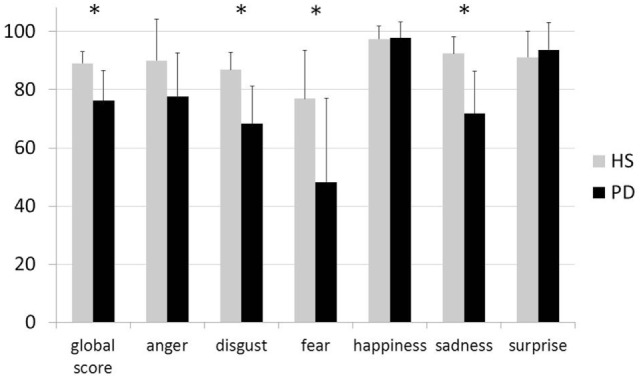
Figure 1.

Results of the Ekman 60 Faces test in healthy subjects—gray histograms and in patients with Parkinson’s disease—black histograms. The X axis indicates the global score and sub-scores for the six basic emotions during the Ekman test; the Y axis indicates the percentage of correct responses in each group. Vertical bars indicate 1 SD. Asterisks indicate statistically significant between group difference.
