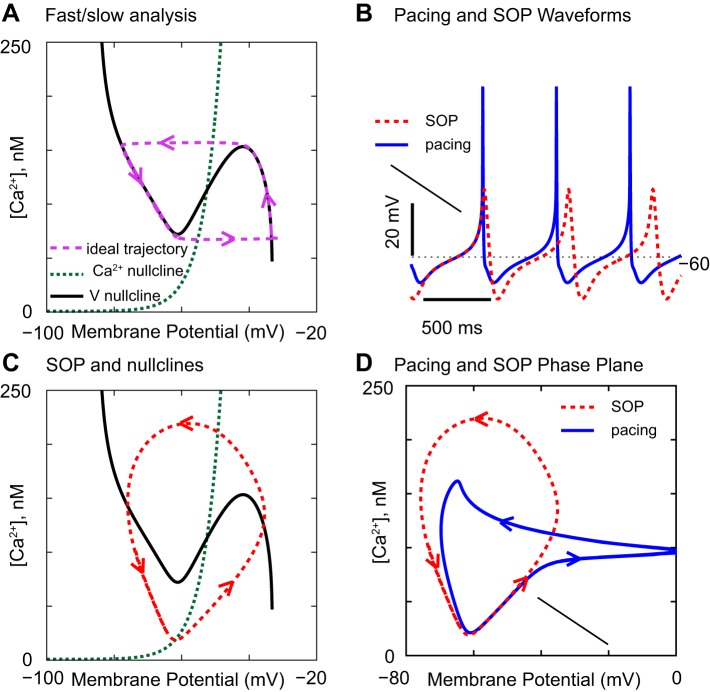
Fig. 1.
How the phase portrait with respect to V and Ca2+ affects the slow oscillatory potentials (SOPs) and pacemaking. The NaV conductance was 550 μS/cm2 for the blue traces and 0 for all other curves. The fraction of free, unbuffered Ca2+ in the model was 0.05% in A and 5% in all other panels. A: phase-plane portrait of an idealized oscillation that strictly observes the separation of time scales. B: simulation of pacemaking and of the SOP. C: nullclines only approximately shape the SOP in the model. D: blue trajectory shows the contribution of the NaV conductance during spiking compared with during SOP.

