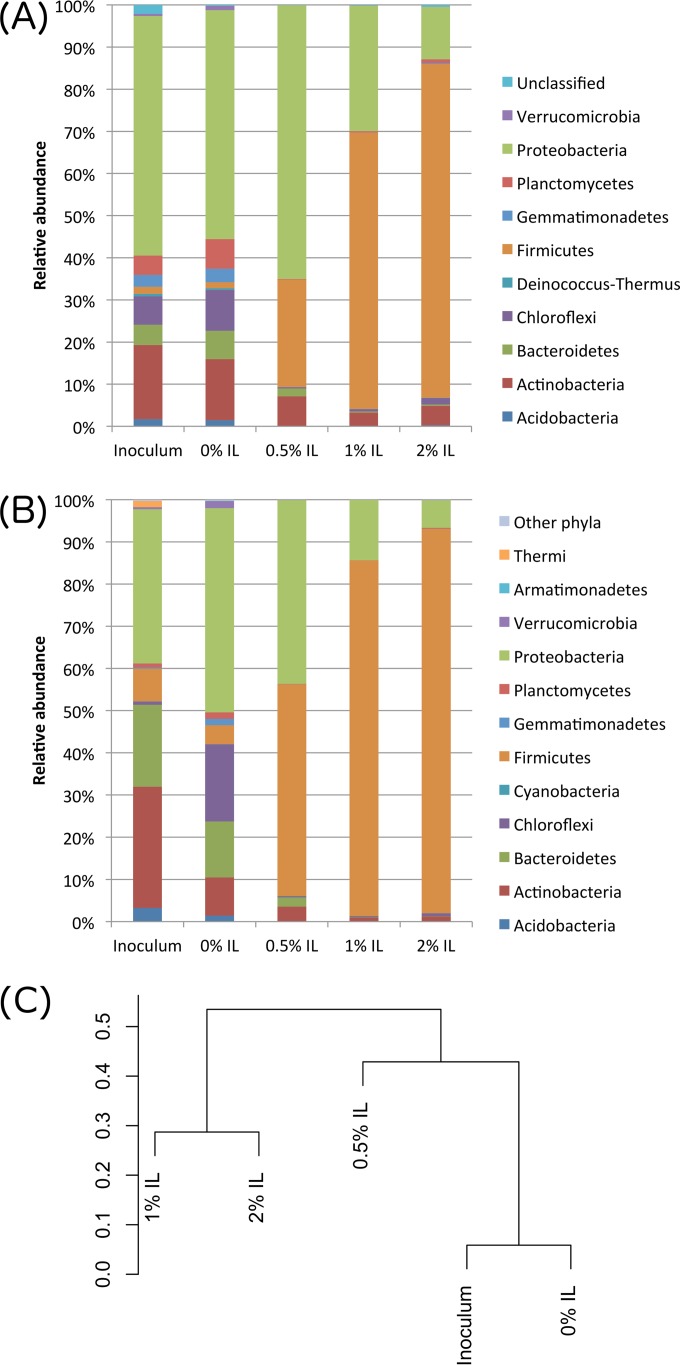
FIG 2 .
Relative abundances of phyla in the microbial communities under conditions of various IL concentrations. (A and B) DNA sequence data were binned and assigned to the nearest taxonomic classification based on full metagenome analysis (A) and iTag 16S ribosomal RNA analysis (B). (C) Distance tree showing separation of metagenomes.

