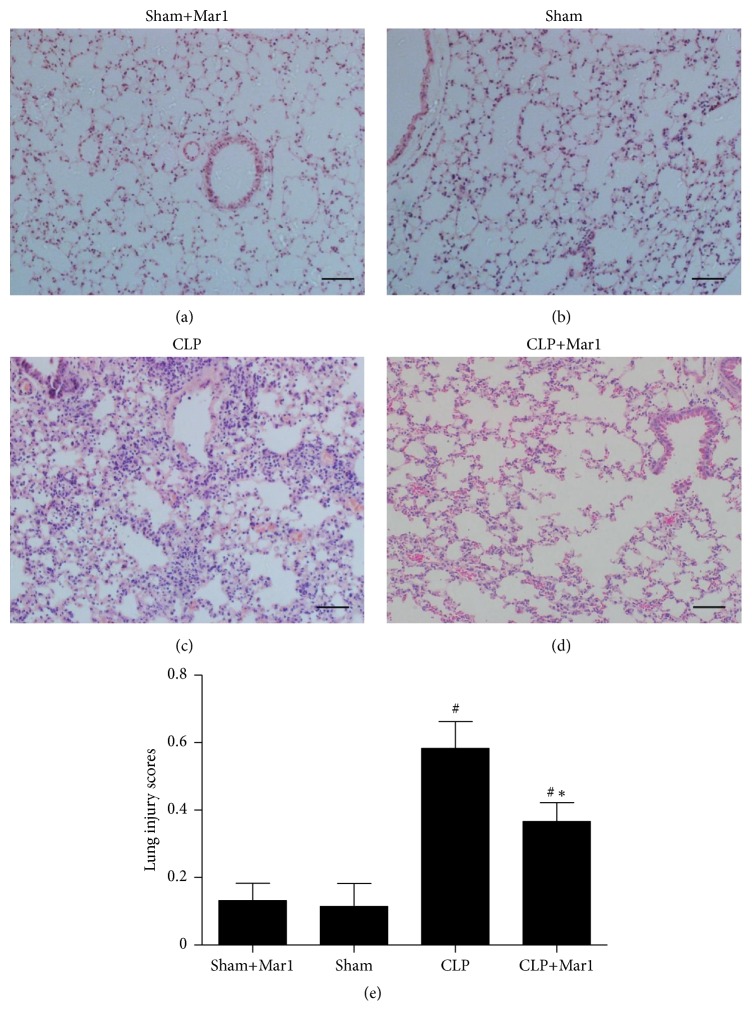
Figure 4.
Improvement of lung histopathological changes by Mar1 in CLP mice. Lung tissues were obtained 24 hours after CLP. (a, b, c, and d) Representative micrographs from sham+Mar1, sham, CLP, and CLP+Mar1 group are shown. (e) Lung injury score in each group. Data are expressed as means ± SEM. Black bars represent 100 μm. n = 5. # P < 0.05 versus the sham group. ∗ P < 0.05 versus the CLP group.

