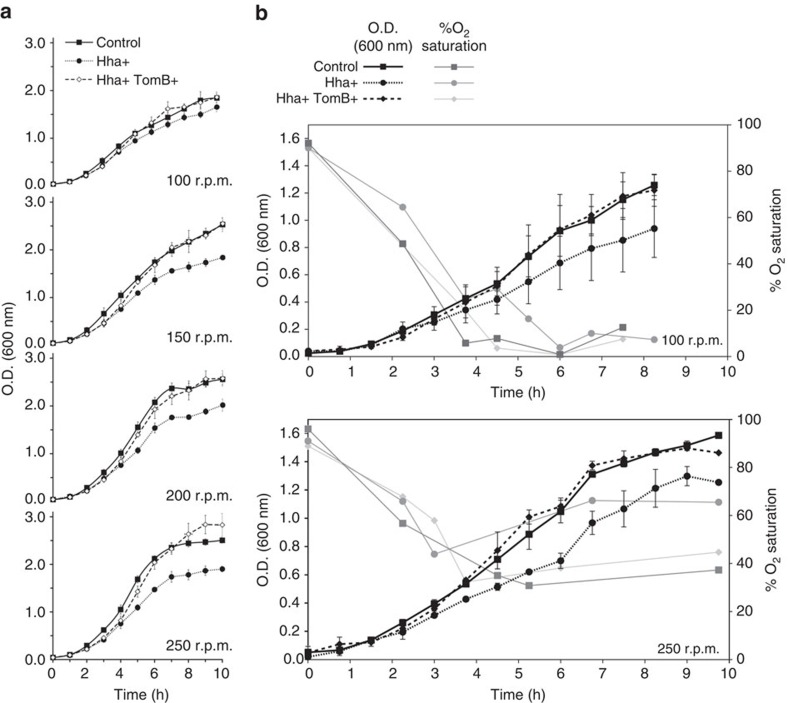
Figure 1. TomB antitoxin activity depends on the agitation rate.
(a) Growth curves of E. coli K-12 MG1655 Δhha cells harbouring pCA24N-hha and pBAD30-tomB at (from top to bottom) 100, 150, 200 and 250 r.p.m. agitation rates. Control cultures with no expression of Hha or TomB (squares) were compared with cultures expressing only Hha (circles) and co-expressing both Hha and TomB (diamonds). Growth curves were measured in triplicate at 37 °C in tryptone minimal medium (TMM; 10 g l−1 tryptone and 2.5 g l−1 NaCl). Error bars represent the sample s.d. (b) Growth curves and simultaneous measurements of the oxygen saturation during culture growth at 150 r.p.m. (top) and 250 r.p.m. (bottom) agitation rates.

