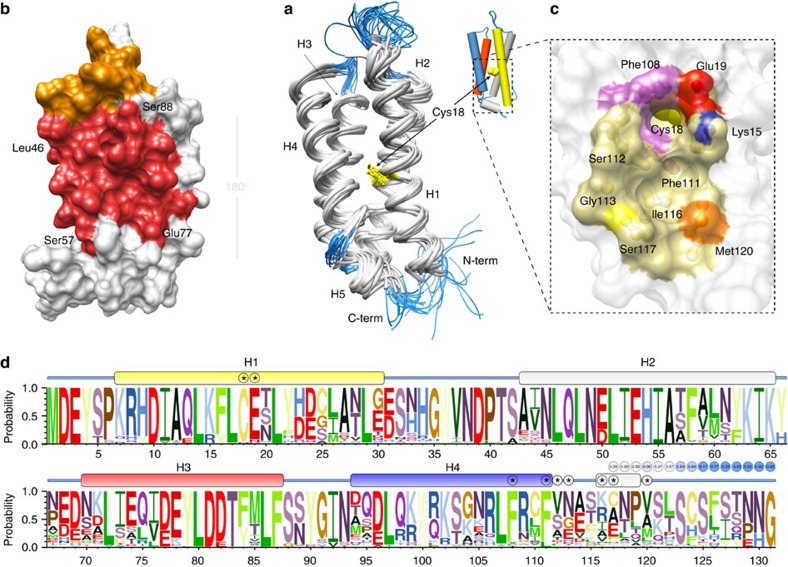
Figure 5. NMR structure of [C117S]YmoB as a model for TomB structure.
(a) Superimposition of 20 lowest energy models. Helical regions (H1: 7–30; H2: 43–65; H3: 70–87; H4: 94–111; and H5: 116–119) are shown in white and non-structured regions in blue. C18 is coloured yellow. The same colour is used for H1 in the topological representations. Helices H3 (negatively charged) and H4 (positively charged) are represented in red and blue, respectively. (b) Surface representation of the residues broadened in the presence of paramagnetically labelled Hha. Those located in helices H2 and H3 are shown in red. Additional affected residues, (mainly in loops) are marked in orange (see Supplementary Fig. 4). The structures in a,b are rotated 180°. Most of the residues contacting Hha are located in one side of the structure. (c) Expanded view of the pocket and channel defined by conserved residues F108 and F111 (purple), K15 (blue), E19 (red) and S117 (C117 in wild-type YmoB, yellow) connecting the surface with the location of the sulfur atom of C18. M120, also susceptible to oxidation and close to C117, is shown in orange. The entry of the channel is located in the opposite face from the Hha-binding site. S117 is occupied by cysteine in the wild-type form of YmoB. (d) Logo representation of the sequence variability within the YbaJ-superfamily. Secondary structure of [C117S]YmoB is represented. An asterisk highlights residues forming the pocket surrounding C18. Some of the sequences terminate after position 116. The proportion of sequences that extended to a given position is shown and colour-coded in circles at the C-terminal end of the logo representation.

