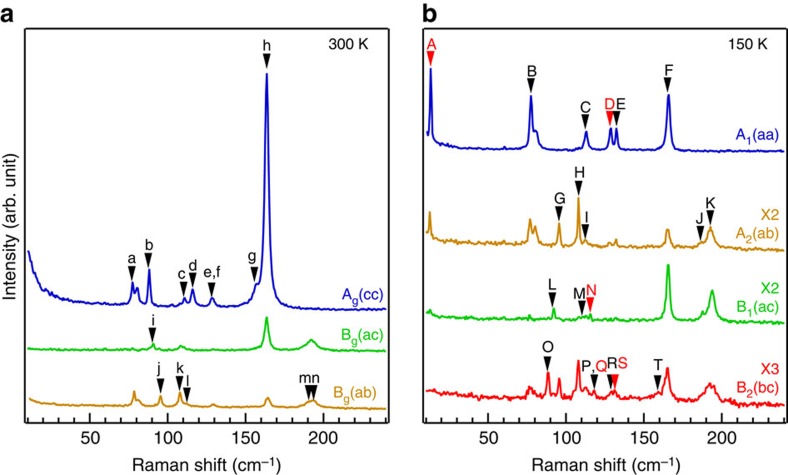
Figure 2. Polarized Raman spectra measured in the high- and low-temperature phases.
(a,b) Polarized Raman spectra measured at 300 K (a) and 150 K (b). The identified Raman peaks are labelled by lowercase (high-temperature phase) and capital (low-temperature phase) letters. The red labels A, D, N, Q and S mark the Raman modes that are directly sensitive to the inversion symmetry breaking. The small peak at 83 cm−1 is from the instrument and not intrinsic to the sample.

