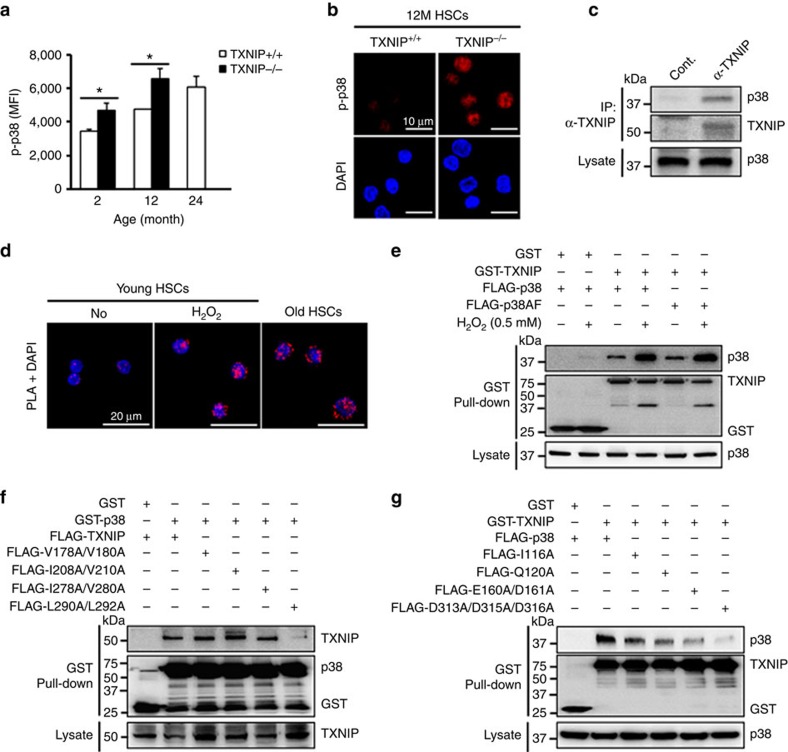
Figure 2. The activation of p38 in TXNIP−/− HSCs and physical interaction between TXNIP and p38 in HSCs.
(a) Levels of p38 phosphorylation were determined by mean of fluorescence intensity using flow cytometry in LT-HSCs (n=3 from two experiments). (b) Confocal images of phospho-p38 in 12-month-old LT-HSCs (n=3 from two experiments). (c) Immunoprecipitation assay in young BM cells (repeated two times). (d) In situ PLA images in young LT-HSCs or old HSCs. Freshly isolated LT-HSCs were treated with 0.5 mM H2O2 for 1 h in HSC media (repeated two times). (e) GST pull-down assay in 293T cells (repeated two times). (f,g) GST pull-down assays in 293T cells (repeated three times). Data are mean±s.d. Statistical significance was determined using a two-tailed Student's t-tests. *P<0.05.

