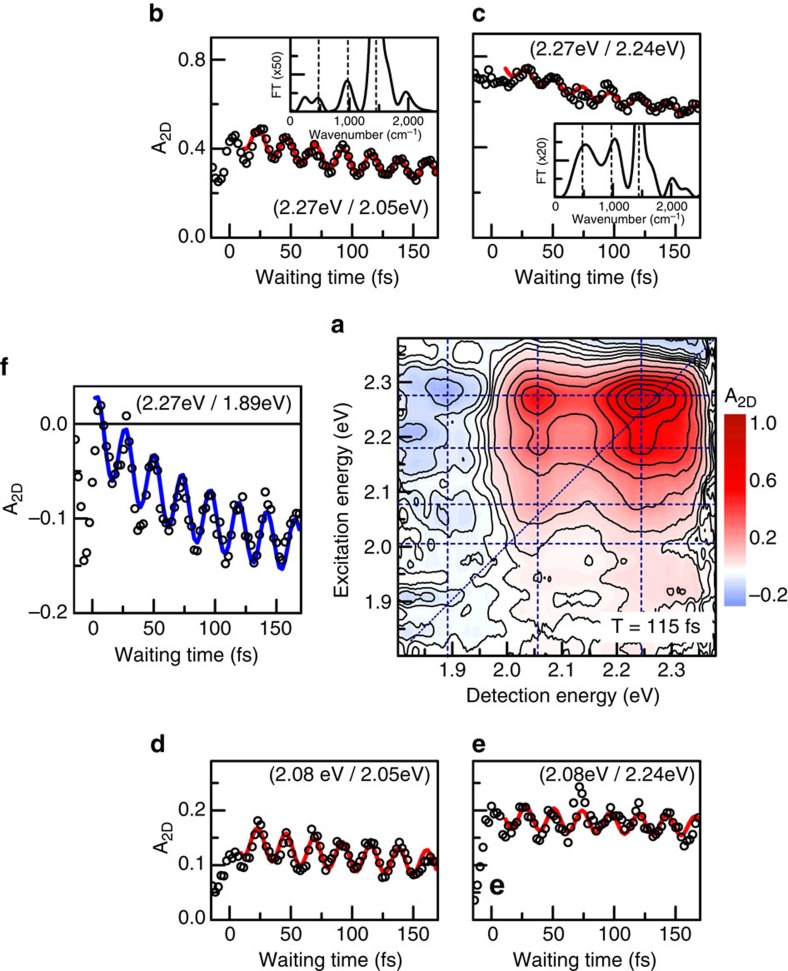
Figure 2. Dynamics of relevant peaks in the absorptive 2DES maps.
(a) 2DES map at waiting time of 115 fs. We detect a series of positive (A2D>0) bleaching peaks and negative peaks for detection around 1.89 eV, reflecting photoinduced absorption of polaron pairs. The corresponding resonances are marked by dashed lines. (b–e) The dynamics of different positive vibronic peaks (open circles) show pronounced, long-lived oscillations, predominantly with 23-fs period (fit: red line). Fourier spectra (insets in b,c) reveal additional oscillatory components at 500−1, 1,000−1 and 2,000 cm−1. (f) Remarkably, the negative polaron pair peak amplitude (open circles) displays strong oscillations with 23-fs period and rises within 100 fs (blue line). All these features are distinct signatures of coherent polaron pair formation.

