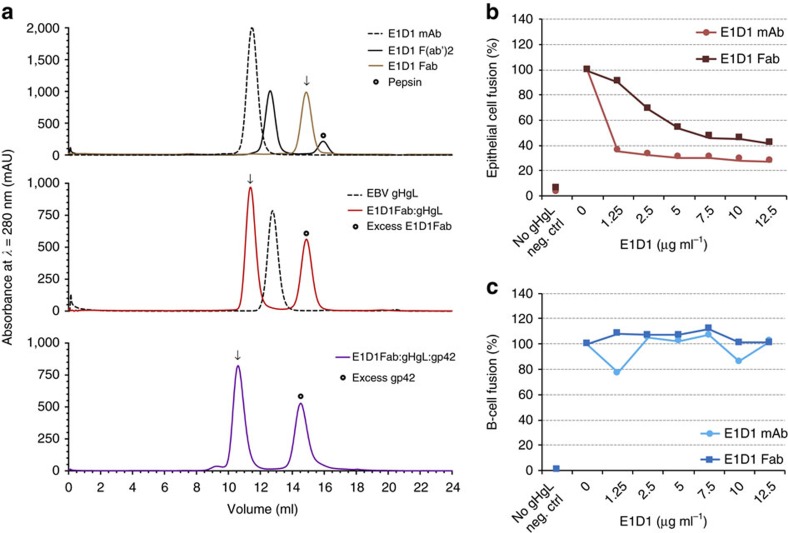
Figure 1. E1D1 mAb and Fab bind gHgL and selectively inhibit epithelial-cell fusion.
(a) Assembly of E1D1 Fab complexes with gHgL and gHgL/gp42 monitored by size exclusion chromatography. Top panel: E1D1 mAb (dashed black line), E1D1 F(ab')2 (black line) and E1D1 Fab (brown line). Middle panel: gHgL (dashed black line) and E1D1Fab:gHgL (red line). Lower panel: E1D1Fab/gHgL/gp42 complex (violet line). Arrows mark the major peak fraction of interest. Calibration of Superdex 200 10/300 GL column gave the following elution volume (Ve) versus apparent molecular weight (MW) relationship: log10(MW, kDa)=−0.1958*(Ve, ml)+4.527 with number of theoretical plates (N/m) of 12,137 (nominal value >10,000) and peak symmetry (As)=1.227 (nominal range, 0.70<As<1.30). (b,c) Inhibition of fusion activity by E1D1 mAb and Fab. The x-axis indicates the amount of purified E1D1 antibody expressed as a final concentration of E1D1 mAb or Fab (μg ml−1) as present in a luciferase based cell–cell fusion assay using (b) epithelial cells (maroon) and (c) B cells (blue). No gH and gL plasmids transfected serves as the negative control denoted as neg. ctrl.

