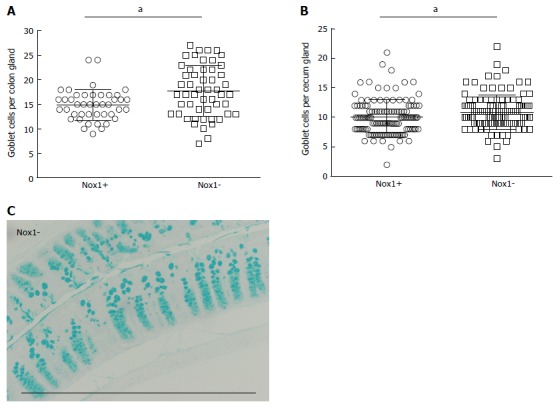
Figure 2.

Goblets per colon (A) and cecum gland (B) counted from cross sections stained with Alcian blue and nuclear fast red (C). Each point in panels A and B represents a separate gland. Between 3-15 and 7-14 glands (obtained from 8 WT and 9 Nox1-KO mice) were counted from colon and cecum, respectively. Scale bar approximately 0.5 mm. "a" indicates a statistically significant difference between the 2 groups.
