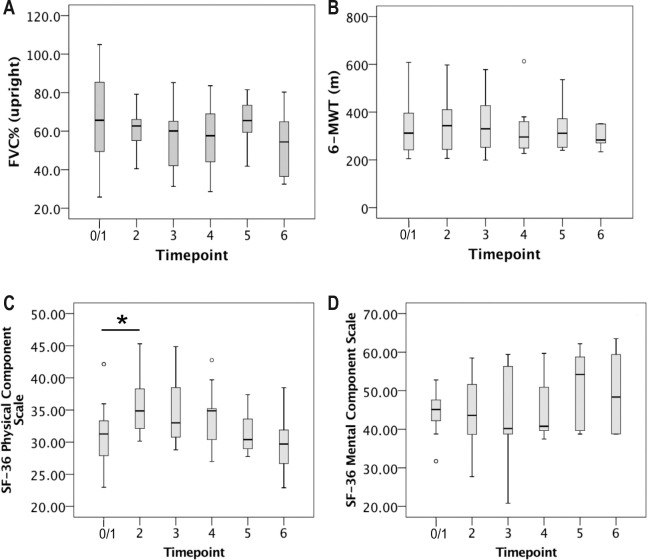
Figure 1. Upright forced vital capacity (FVC), walking performance, and health-related quality of life between T1 and T6.
Mean upright forced vital capacity (% predicted) (A), mean 6-min walking test (6-MWT) walking distance (B), and self-reported quality of life (C,D) over time in patients with late-onset Pompe disease on noninvasive ventilation (NIV). Number of patients was 15 at T0 (no NIV), 13 at T2, 11 at T3, 9 at T4, 8 at T5, and 6 at T6. Boxes depict mean, lower (Q1) and upper quartile (Q3). Whiskers represent data falling n between Q1 and Q1 – 1.5 × interquartile range (IQR) or Q3 and Q3 + 1.5 × IQR, respectively. Statistical comparison between subsequent timepoints was performed by means of analysis of variance for repeated measures. Asterisks show statistically significant changes between timepoints (*p < 0.05).

