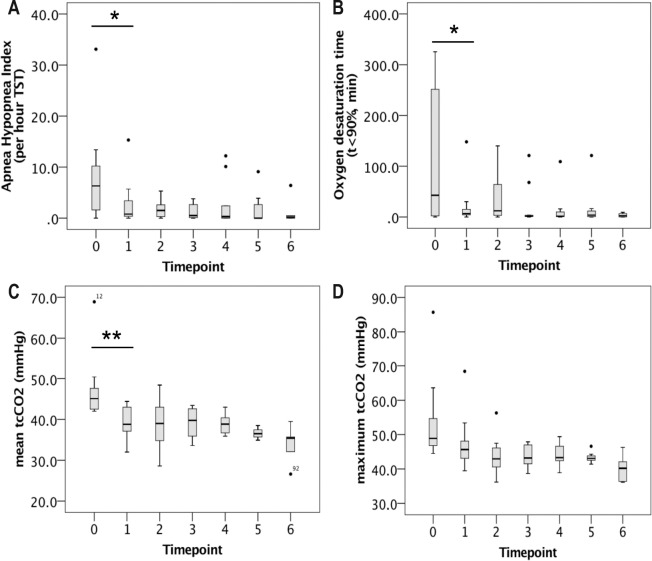
Figure 2. Long-term nocturnal ventilation outcomes in patients with late-onset Pompe disease started on noninvasive ventilation (NIV).
Number of patients was 15 at T0 (no NIV), 13 at T2, 11 at T3, 9 at T4, 8 at T5, and 6 at T6. Panels show apnea-hypopnea index (A), oxygen desaturation time (B), mean tcCO2 (C), and maximum tcCO2 (D). Single data points represent outliers. Asterisks show statistically significant changes between timepoints (*p < 0.05, **p < 0.01). Statistical comparison between timepoints was performed by means of analysis of variance for repeated measures. tcCO2, transcutaneous carbon dioxide tension; TST, total sleep time (in hours).

