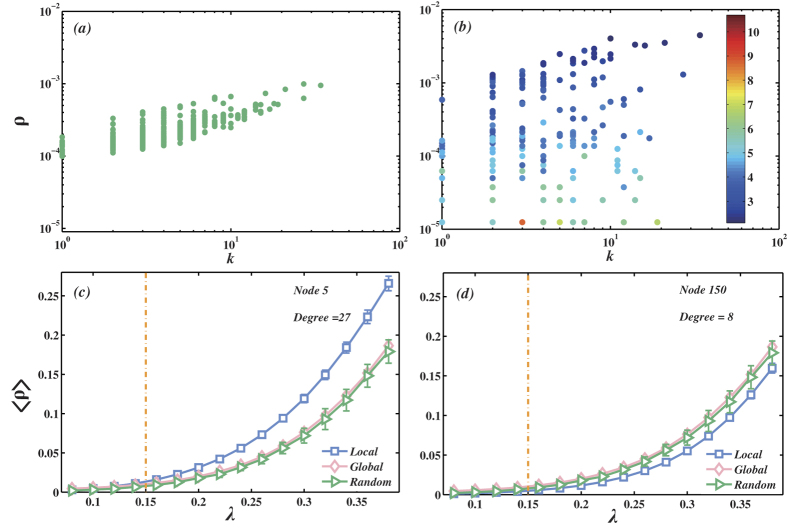
Figure 2.
(a) The dependence of the fraction of infected target nodes ρ on the initial spreaders’ degree k. In this sub-figure, all the nodes in the network are target nodes. (b) The dependence of the fraction of infected target nodes ρ on the initial spreaders’ degree k and the mean shortest path length 〈d〉 from the spreader to the target nodes. The color of each point represents the 〈d〉 of the spreader. In this sub-figure, there are only 20 target nodes. A node is randomly selected as a center and the rest of the targets are placed in the nodes with the shortest path length no larger than 2 to the center. Center nodes are also target nodes. In both (a,b), the infection probability λ = 0.12, slightly smaller than the critical infection probability λc = 0.15. (c,d) The average fraction of infected target nodes 〈ρ〉 as a function of infection probability λ. In pink rhombus line, all the nodes in the network are target nodes. In green triangle line, we randomly select 20 nodes as the target nodes, while in blue square line, the method of choosing target nodes is the same as (b). The difference between (c) and (d) is that the center has k = 27 in (c) while k = 8 in (d). In all sub-figures, the networks are Netsci with N = 379 and 〈k〉 = 4.8. The results are obtained by averaging 500 independent realizations.

